Figure 4.
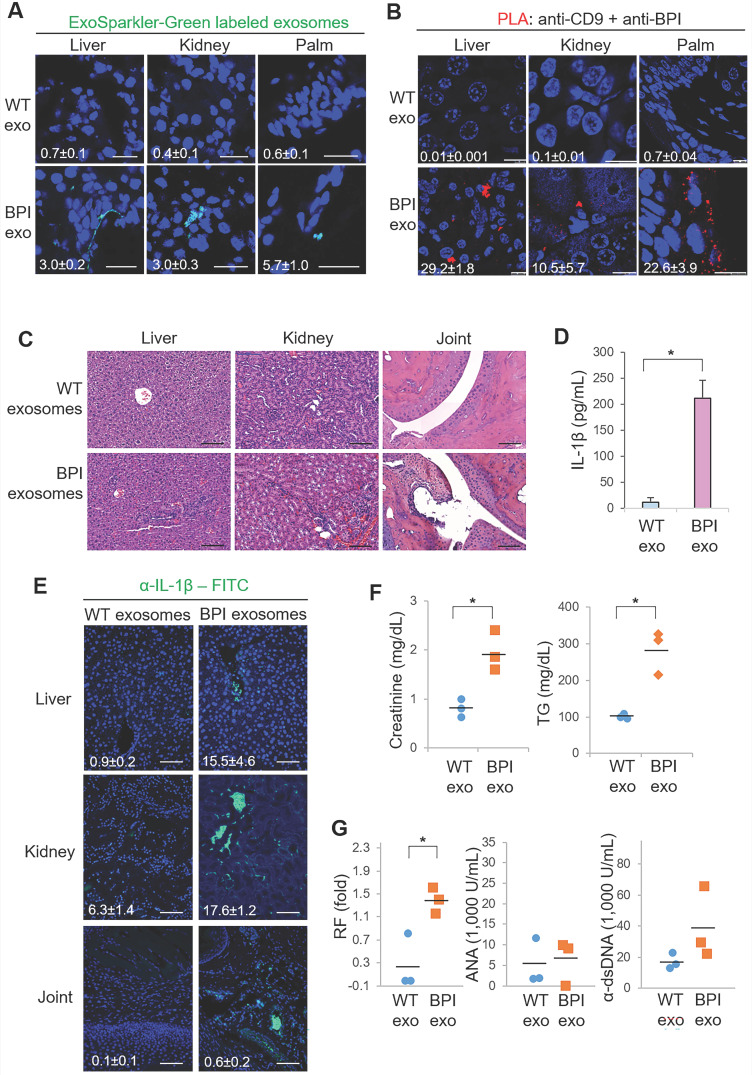
BPI transgenic T-cell-derived exosomes induce inflammation in recipient mice. (A) Confocal microscopy analysis of fluorescent dye (green)-labeled exosomes in the liver, kidney, and palm of wild-type recipient mice. Exosomes were isolated from supernatants of WT or Lck-BPI Tg T cells by ExoQuick-TC. ExoSparkler-Green labeled exosomes were adoptively transferred into wild-type recipient mice by intravenous injection every 3 days for 9 days. Cell nuclei were stained with DAPI (blue). Original magnification, ×630; scale bars, 25 µm. Mean ± SEM of relative fluorescence intensity values (FITC versus DAPI, 10-6/um2) from 5 images are shown at the bottom of individual panels. (B) In situ PLA assays of close proximity (<40 nm) between BPI and CD9 as BPI-containing exosomes in the liver, kidney, and palm of wild-type recipient mice using anti-human BPI antibody plus anti-CD9 antibody. Cell nuclei were stained with DAPI. Original magnification, x630. Scale bars, 10 µm. Mean ± SEM of relative fluorescence intensity values (PLA versus DAPI, 10-6/um2) from 5 images are shown at the bottom of individual panels. (C-F) Exosomes derived from wild-type or Lck-BPI T cells (WT exo or BPI exo) were adoptively transferred into recipient mice by intravenous injection every 3 days for 24 days. n = 3 (biological replicates) per group. (C) Hematoxylin and eosin (H&E)-stained sections of the liver, kidney, and joint from recipient mice. Scale bars, 100 µm. For the liver, the immune cell aggregation regions were presented as the ratio of aggregation area divided by the entire view area. WT-exosome recipient mice, 2.5 ± 1.1 x 10⁻⁵; BPI-exosome recipient mice, 7.3 ± 2.6 x 10⁻⁴. Data shown are mean ± SD of 5 images. For kidney, the diameters of glomeruli were 55.8 ± 7.3 µm for WT-exosome recipient mice and 81.8 ± 14.7 µm for BPI-exosome recipient mice. The mesangial cell numbers were 41.0 ± 10.6/glomerulus for WT-exosome recipient mice and 70.7 ± 9.5/glomerulus for BPI-exosome recipient mice. Data shown are mean ± SD of 10 glomeruli. (D) ELISA of serum IL-1β levels in recipient mice. (E) Immunohistochemical staining of FITC-conjugated anti-IL-1β antibody (green) in the paraffin-embedded sections of the liver, kidney, and joint from recipient mice. Cell nuclei were stained with DAPI (blue). Scale bars, 100 µm. Mean± SEM of relative fluorescence intensity values (FITC versus DAPI, 10-6/um2) from 5 images are shown at the bottom of individual panels. (F) Serum creatinine and triglyceride (TG) of wild-type recipient mice were determined using serum chemistry assays. (G) ELISA of serum anti-nuclear antibody (ANA), rheumatoid factor (RF), and anti-dsDNA antibody in recipient mice. *, P value < 0.05 (two-tailed Student's t-test). Data shown (A-G) are representatives of three independent experiments.

