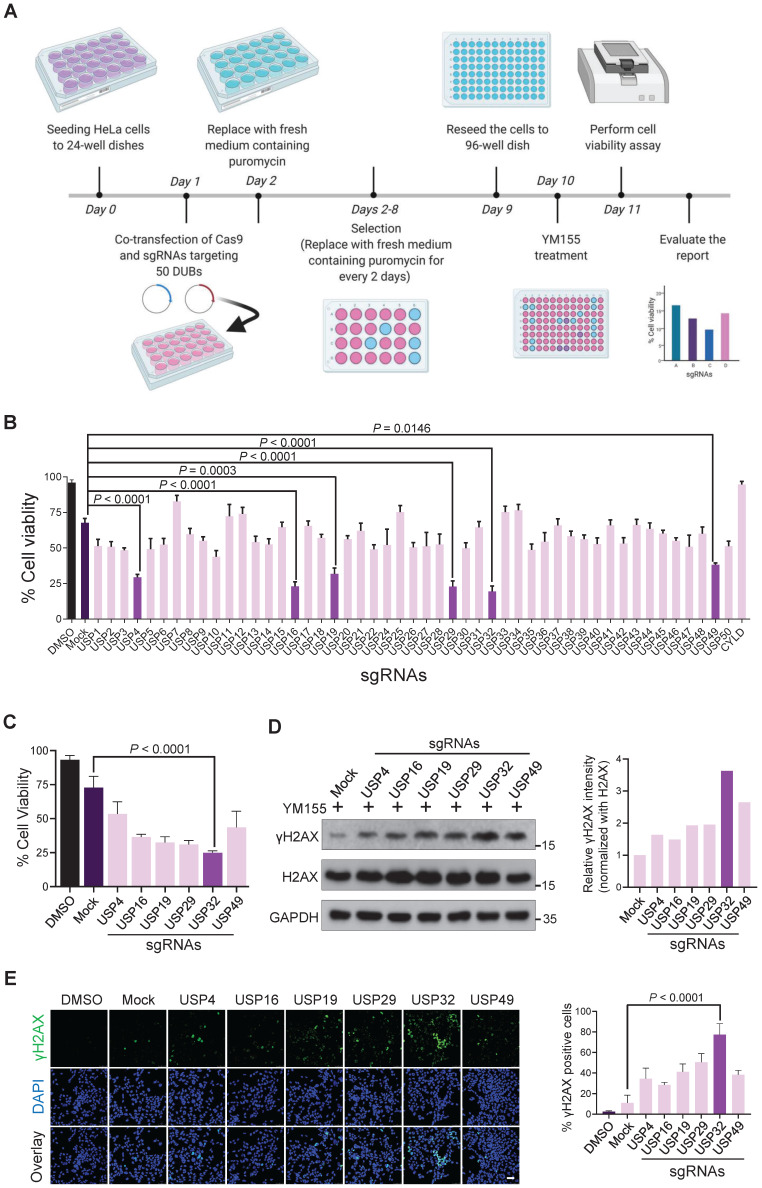
Figure 1.
CRISPR-based genome-scale screening of USPs family proteins showing drug resistance to YM155 treatment through cell viability assay. (A) Schematic of a screening system based on DUB knockout and YM155 treatment. Day 0: HeLa cells were seeded and maintained in DMEM. Day 1: A DUB-knockout library kit consisting of sgRNAs individually targeting an entire set of genes encoding USPs along with Cas9 were co-transfected using the Lipofectamine 2000 in HeLa cells. Day 2: Complete medium containing puromycin (2 µg/mL) was replaced. Day 2-8: Cells were grown under puromycin selection for a week. Day 9: HeLa cells were re-seeded to 96-well plates at a density of 10,000 cells/well for a cell viability assay. Day 10 and 11: 25 nM YM155 was treated and incubated for 24 h and subjected to the cell viability assay. (B) The percentage of cell viability was measured from (A) and plotted as a bar graph. HeLa cells treated with DMSO served as a negative control. HeLa cells co-transfected with scrambled sgRNA and Cas9 and then treated with YM155 served as mock control. (C) Cell viability of the top-ranking candidates. (D) HeLa cells were transfected with the top-ranking candidates and treated with 25 nM YM155 for 24 h and subjected to western blotting with γH2AX antibodies. H2AX and GAPDH were used as loading controls. Relative expression of γH2AX was quantified using ImageJ software (right panel). (E) Immunofluorescence images showing γH2AX foci formation in HeLa cells co-transfected with the top-ranking candidates and treated with 25 nM YM155 for 24 h. γH2AX positive cells were quantified and represented as a bar graph (right panel). (B, C and E) Data are presented as the mean and standard deviation of three independent experiments. One-way ANOVA followed by Tukey's post hoc test was used with the indicated P value. Scale bar = 50 µm.

