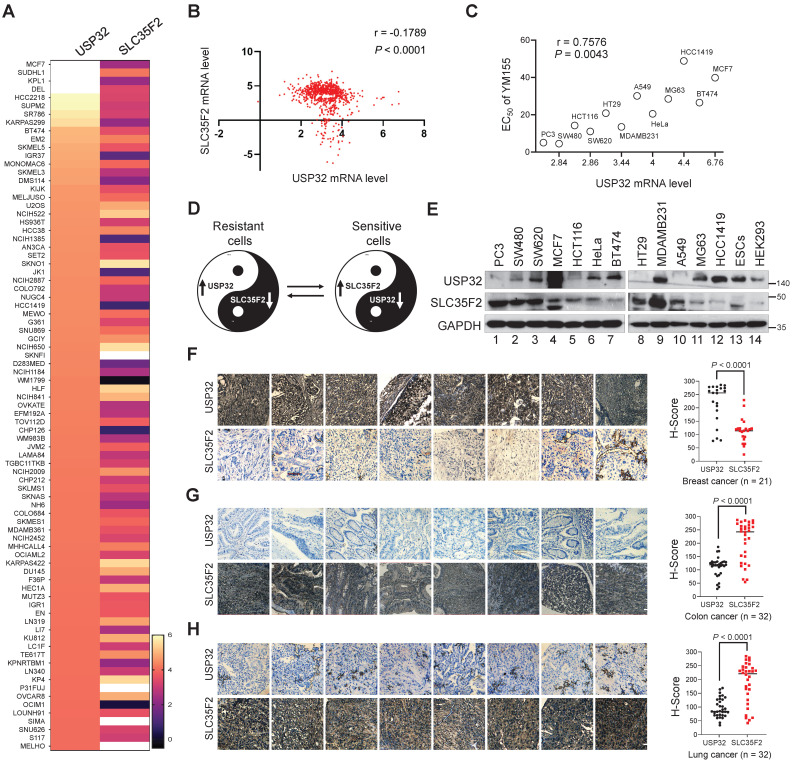
Figure 5.
USP32 and SLC35F2 expression patterns are negatively correlated across wide panel of cancer cells. (A) A heat map showing mRNA expression levels of USP32 and SLC35F2 derived from the CCLE panel. Representative samples are arranged from high to low mRNA levels of USP32 and corresponding SLC35F2 values are sorted. (B) A scatterplot was made between USP32 and SLC35F2 mRNA levels. Pearson correlation analysis was used to quantify the relationship between USP32 and SLC35F2. (C) EC50 values for YM155 were derived for the indicated cell lines and presented as a function of USP32 mRNA expression levels. (D) A Yin-Yang model showing the resistant and sensitive patterns of cancer cells to YM155 drug. (E) Endogenous protein expression patterns of USP32 and SLC35F2 in different cancer and non-cancer cell lines were analyzed by western blot analysis. (F-H) Representative immunohistochemical (IHC) staining images of endogenous USP32 and SLC35F2 in human breast cancer (n = 21), colon cancer (n = 32) and lung cancer (n = 32) tissues. All IHC images were quantified by an H score. A two-tailed t test was used and P values are as indicated. Scale bar = 50 µm.

