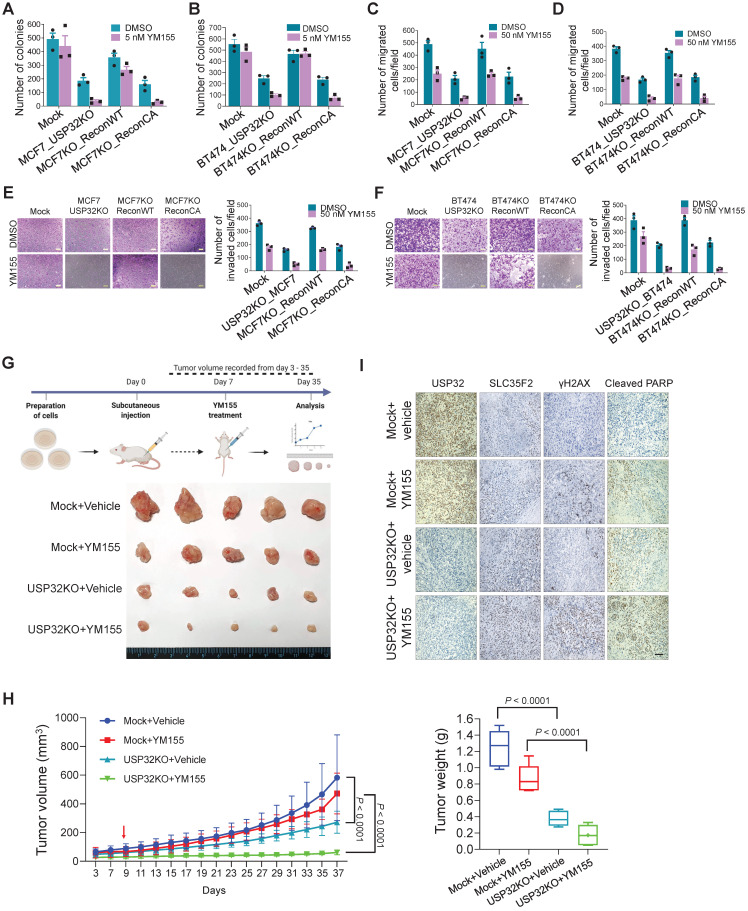
Figure 8.
USP32 knockout inhibits tumor progression in vitro and in vivo. Colony formation assay was performed for (A) MCF7 mock, MCF7_USP32KO, MCF7KO_ReconWT, and MCF7KO_ReconCA cells; (B) BT474 mock, BT474_USP32KO, BT474KO_ReconWT, and BT474KO_ReconCA cells treated with either DMSO or 5 nM of YM155 for 14-days. The number of colonies was quantified and is presented graphically. Data are presented as the mean and standard deviation of three independent experiments. (C-D) Transwell cell migration assays were performed for the indicated cells treated with either DMSO or 50 nM YM155 for 24 h. Migrated cells were quantified using ImageJ. Data are presented as the mean and standard deviation of three independent experiments. (E-F) Transwell cell-invasion assays were performed for the indicated cells treated with either DMSO or 50 nM YM155 for 24 h. Invaded cells were quantified using ImageJ. Data are presented as the mean and standard deviation of three independent experiments. The number of invaded cells per field was quantified and represented graphically (right panels). (G) MCF7 wild-type and USP32 KO cell lines were prepared and subcutaneously injected into the right flank of NSG nude mice (n = 5). At day 7, mice were randomized into four groups as indicated and intraperitoneally injected with either saline (vehicle) or YM155 (7.5 mg/kg) twice in a week. Tumor volumes were recorded and stored for IHC experiments. The bottom panel shows the tumors excised from the mice after the experiment. (H) Tumor volume was measured every other day and is presented graphically. Data are presented as the mean and standard deviation (n = 5). Two-way ANOVA followed by Tukey's post hoc test was used and P values are as indicated. (I) Xenograft tumor tissues were sectioned and embedded in paraffin. Immunohistochemical analysis was performed with the indicated antibodies. Scale bar = 50 µm.

