FIGURE 5.
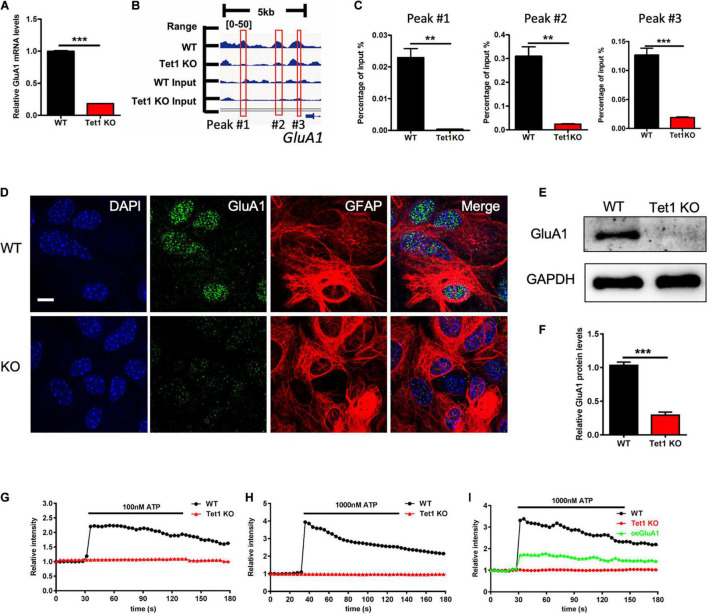
Tet1 deficiency inhibits the expression of GluA1 and reduces Ca2+ signaling. (A) 5hmC-seq data analysis identified three loci on GluA1 showing significant 5hmC enrichment for wildtype astrocytes but not for Tet1 KO astrocytes. (B) qPCR results validated the decreased 5hmC enrichment on GluA1. Fold enrichment was calculated as 2-dCt, where dCt = Ct (5-hmC enriched)—Ct (input). Data were presented as mean ± SEM, n = 3, unpaired t-test; **P < 0.01; ***P < 0.001. (C) Representative immunostaining images of GluA1 and Gfap with WT and Tet1 KO astrocytes. Scale bar, 20 μm. (D–F) qRT-PCR (D) and western blot assay results (E,F) showed that Tet1 KO significantly reduced the level of GluA1. Data were presented as mean ± SEM, n = 3, unpaired t-test; **P < 0.01; ***P < 0.001. (G,H) Representative images show the different Ca2+ signal intensity between WT and Tet1 KO astrocyte evoked by 100 nM ATP (A), 1,000 nM (B) ATP, respectively, which indicated by Fluo. 8 am. 8–10 cells were analyzed for each group. (I) Ectopic GluA1 restored Ca2+ signaling of Tet1 KO astrocytes. WT astrocyte was infected with lentivirus expressing RFP. KO astrocytes were infected lentivirus expressing RFP, and RFP-GluA1, respectively. 8–10 cells were analyzed for each group.

