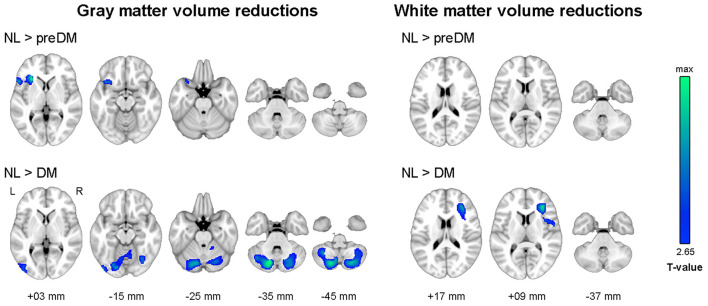
Figure 1.
Results of whole-brain analyses showing reduced gray and white matter volume in dysglycemia compared to normal glucose tolerance. Family-wise error corrected p < 0.05 at cluster level with underlying voxel level of uncorrected p < 0.005. NL, normal control group; preDM, prediabetes group; DM, type 2 diabetes group.

