FIGURE 6.
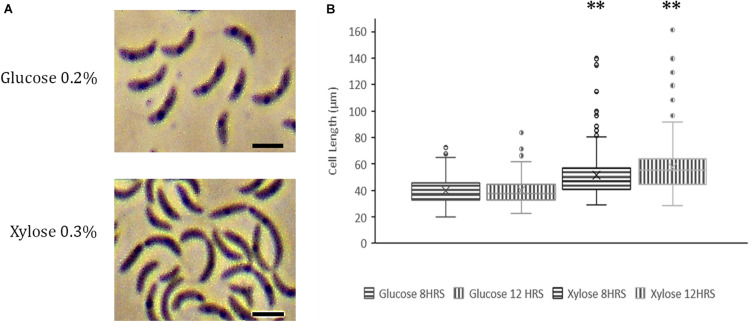
YbaBCc overexpression in wild-type C. crescentus. (A) Overexpression of YbaBcc leads to morphological defects in C. crescentus. Expression of YbABCc from plasmid pJS14 was induced by the addition of 0.3% xylose at an OD of 0.2 and cells were visualized at the indicated time points by Phase Contrast Microscopy (left panel). All images were taken at 100X magnification and optical zoom 1.5X (Scale bar: 2 μm). (B) Distribution of cell length in populations of YbaBCc overexpressing cells. Micrographs of the strains described in (A) were subjected to automated image analysis. Cell lengths were determined by Oufti Software. Box and whisker plots (n = ± 210 per time point and strain) were generated for statistical analysis of imaging data with the whiskers including all data points within 1.5∗IQR. Cross (x) represents mean values. ∗∗p < 0.0001 by one-way ANOVA compared to the glucose-induced control cells.

