. 2021 Oct 28;3(5):e210102. doi: 10.1148/ryct.2021210102

Figure 3:

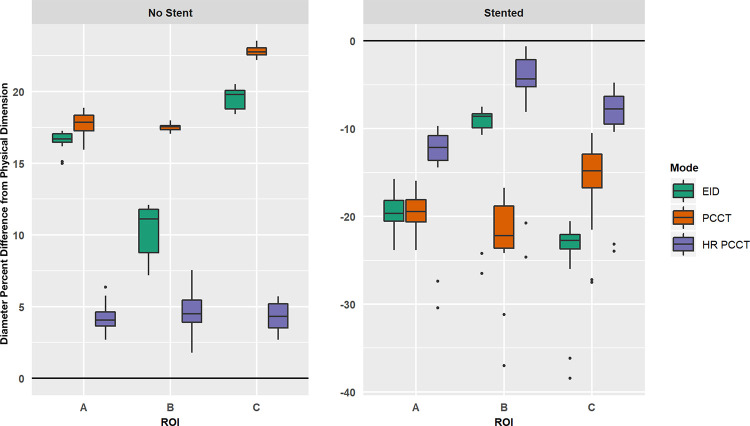
Boxplots of relative percent difference between measured and known physical dimension of coronary probes. Results shown for unstented (left) and stented (right) cases, with x-axis indicating specific region of interest (ROI). Note, the diameter was underestimated in the stented case and thus produced a negative relative percent difference. EID = energy-integrating detector, HR-PCCT = high-resolution PCCT, PCCT = photon-counting CT.

Boxplots of relative percent difference between measured and known physical dimension of coronary probes. Results shown for unstented (left) and stented (right) cases, with x-axis indicating specific region of interest (ROI). Note, the diameter was underestimated in the stented case and thus produced a negative relative percent difference. EID = energy-integrating detector, HR-PCCT = high-resolution PCCT, PCCT = photon-counting CT.