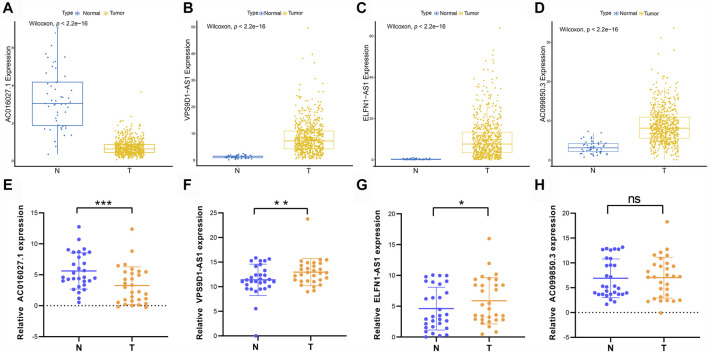
FIGURE 10.
Different expressions of prognostic DE-FLs in CRC tissues and TCGA. (A–D) The different expression levels of 4 DE-FLs in TCGA. (E–G) Q-PCR results demonstrated the down-regulated expression level of AC016027.1 and up-regulated level of VPS9D1-AS1 and ELFN1-AS1 in CRC tissues compared with paired normal tissues. (H) Q-PCR result of expression level of AC099850.3 in CRC tissues compared with paired normal tissues. *, p < 0.05. **, p < 0.01. ***, p < 0.001.

