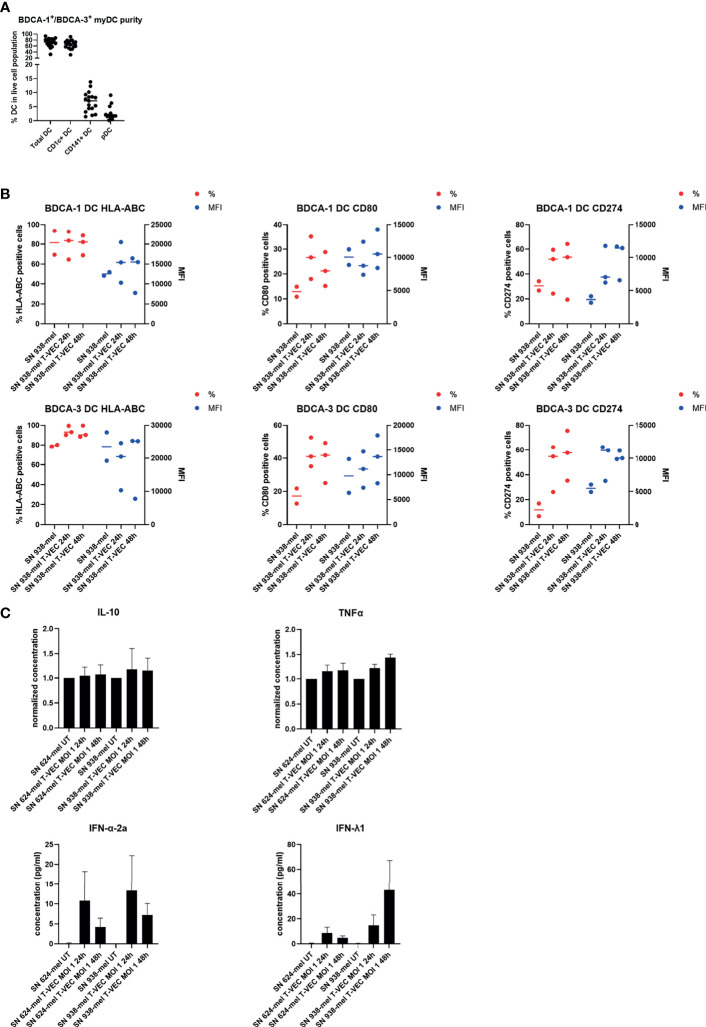
Figure 2.
Effect of supernatant from T-VEC-treated melanoma cells on purified BDCA-1+/BDCA-3+ myDC. (A) The purity of the purified BDCA-1+/BDCA-3+ myDC was analyzed by flow cytometry. This graph depicts the percentage of each DC subpopulation in the live cell population. (B) BDCA-1+/BDCA-3+ myDC were incubated for 24h with supernatant from untreated 938-mel cells, supernatant from 938-mel cells treated with T-VEC (MOI 1) during 24h or supernatant from 938-mel cells treated with T-VEC (MOI 1) during 48 h. After 24 h, the phenotype of the DC was analyzed by flow cytometry. On the left y-axis (red symbols) the percentage of expression of each marker is depicted and on the right y-axis (blue symbols) the mean fluorescence intensity (MFI) is plotted. Each symbol represents the result of an independent experiment, and the line represents the median. (C) On the supernatants from the cultures described in (B), cytokine content was analyzed using MesoScale Diagnostics assays. For IL-10 and TNFα, concentrations were normalized to the conditions with supernatant from untreated tumor cells (either 624-mel or 938-mel) because the absolute cytokine concentrations showed high variation among donors. For IFN-α-2a and IFN-λ1, the actual concentrations are plotted. The graphs depict mean values ± standard error of mean (SEM) and represent data from 6 independent experiments.

