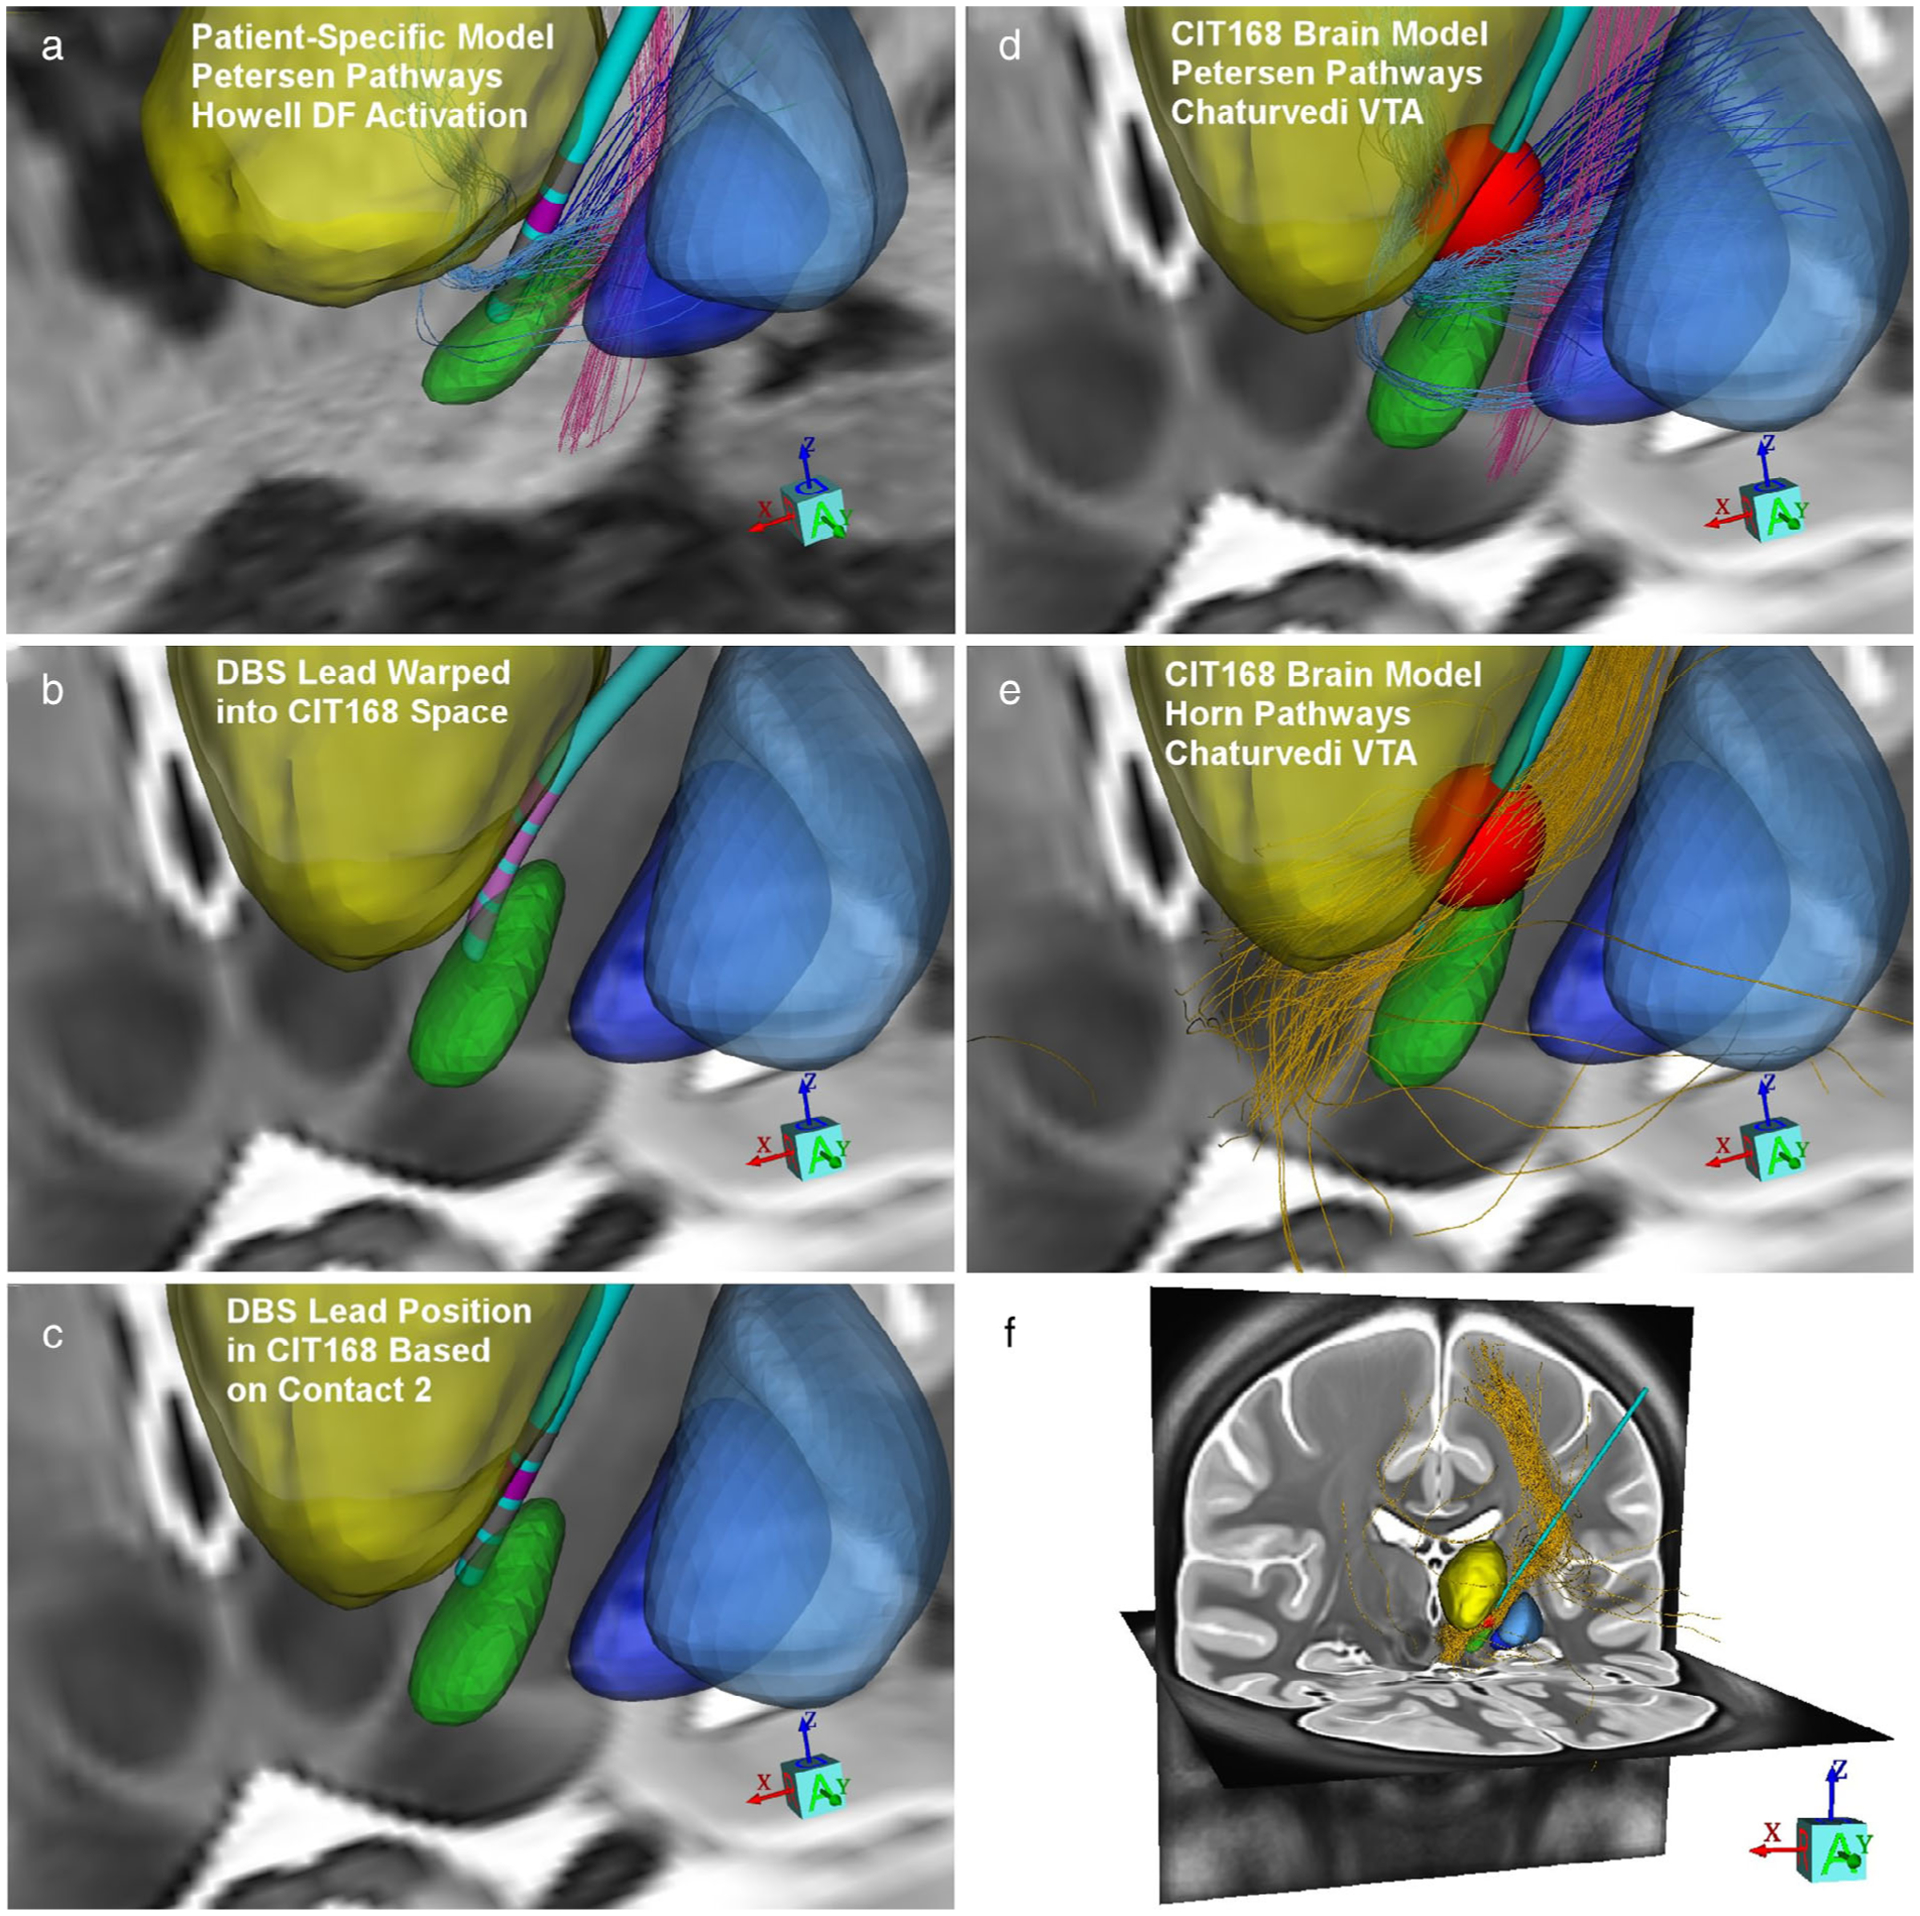
Figure 5.

DBS model comparison. a. Example patient-specific DBS model from Figure 4b (left side of the brain). b. Inverse transform of the patient-specific DBS lead warped into CIT168 brain atlas space. c. DBS electrode model position based on the contact used for stimulation (contact 2). d. Petersen et al. (19) axonal pathways coursing through a Chaturvedi et al. (24) VTA model for the same stimulation parameters as panel a. e. Horn et al. (9) group connectome pathways (gold streamlines) coursing through the same VTA. f. Whole brain view of the group connectome activated pathways.
