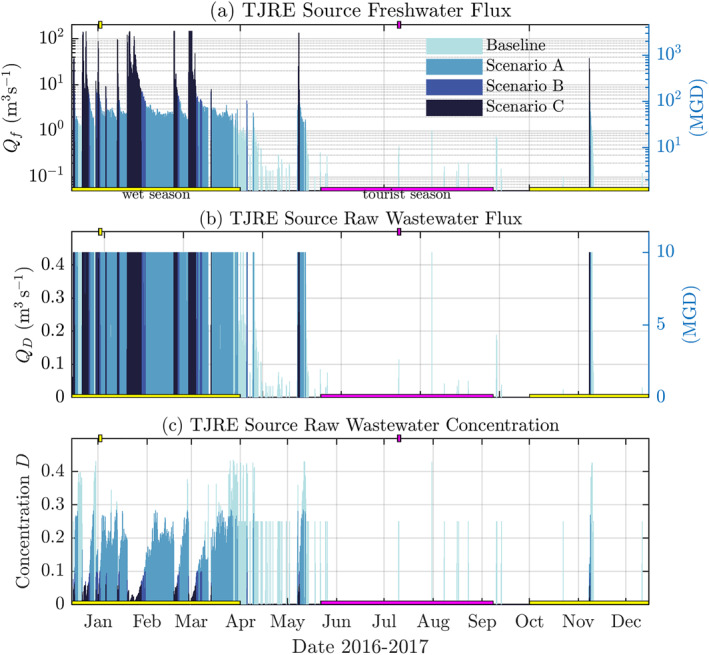
Figure 2.

Timeseries of Tijuana River Estuary (TJRE) inputs over the year 2017 (December 15, 2016 to December 15, 2017) for the four scenarios: (a) freshwater flux Q f (m3 s−1) and (right) million gallons per day MGD, (b) untreated wastewater flux Q D (m3 s−1), and (c) resulting source untreated wastewater concentration D. Colors indicate the Baseline, Scenario A (35 MGD diversion limit), Scenario B (100 MGD diversion limit), and Scenario C (163 MGD diversion limit) as indicated in the legend (see also Table 1). A scenario color is only shown if the diversion limit is exceeded. Thus, a time‐period with Scenario C inflows (darkest blue) also have identical inflows for all Scenarios. However, a time period of Scenario A inflows, has identical Baseline inflows, but no Scenario B or C inflows. At the bottom of all panels, magenta and yellow bars indicate the tourist season (22 May to 8 September) and wet season (1 October to 1 April), respectively. Yellow and magenta markers at the top of each panel indicate the time of the wet and tourist season examples (Figure 4).
