Figure 3.

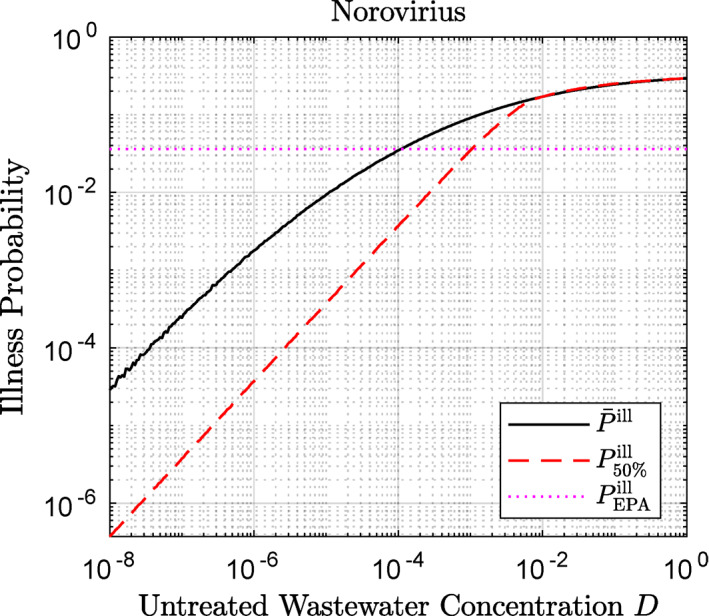
P ill versus untreated wastewater concentration D showing expected (mean) probability , median probability , and the EPA threshold (USEPA, 2012) as indicated in the legend.

P ill versus untreated wastewater concentration D showing expected (mean) probability , median probability , and the EPA threshold (USEPA, 2012) as indicated in the legend.