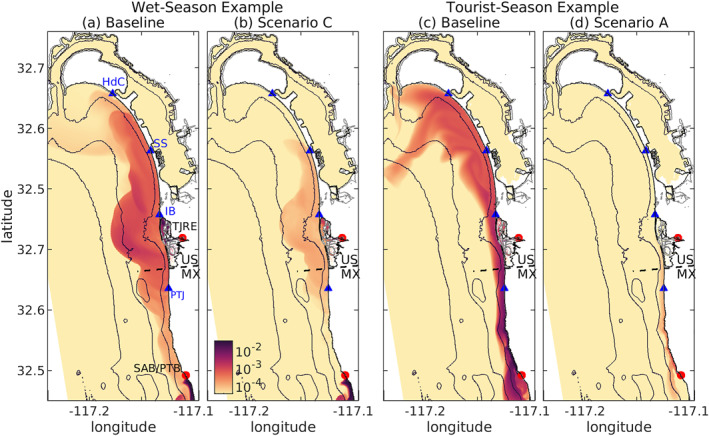
Figure 4.

(a and b) Wet‐season case example from January 3, 2017 10:00 UTC of modeled surface (a) Baseline and (b) Scenario C untreated wastewater concentration D. (c and d) Tourist season case example from July 11, 2017 14:00 UTC of modeled surface (c) Baseline and (d) Scenario A untreated wastewater concentration D. Red dots indicate locations of Tijuana River Estuary (TJRE) and San Antonio de los Buenos outfall at the Pt. Bandera (SAB/PTB) sources. Blue triangles mark specific beaches: Playas Tijuana (PTJ), Imperial Beach Pier (IB), Silver Strand State Beach (SS), and the Hotel del Coronado (HdC). The dashed line marks the US‐Mexico border. These example times are indicated in Figure 2. For the wet season examples (a and b), the TJRE freshwater and untreated wastewater flux (averaged over the preceding 48 hr) are Q f = {4.04, 0.32} m3 s−1 and Q D = {0.44, 0.018} m3 s−1, respectively for the Baseline and Scenario C. For the tourist season examples (c and d), the TJRE freshwater and untreated wastewater flux (averaged over the preceding 48 hr) are Q f = {0.04, 0} m3 s−1 and Q D = {0.01, 0} m3 s−1, respectively for the Baseline and Scenario A. Note, in wet season (a and b), Scenario A is very similar to the Baseline and Scenario B is similar with slightly elevated D to Scenario C. In tourist season (c and d), Scenarios B and C are nearly identical to the Baseline.
