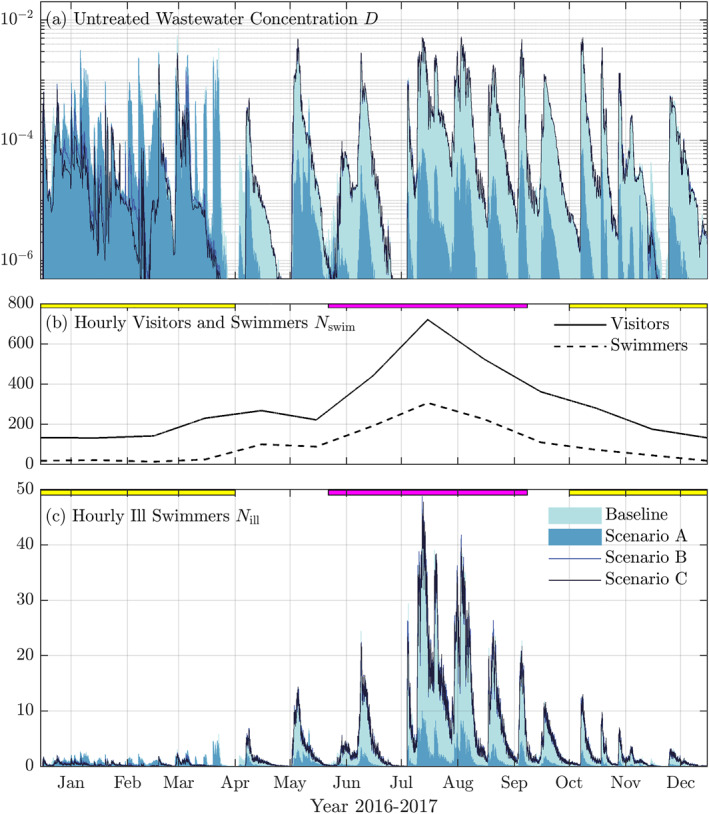
Figure 6.

Timeseries at Imperial Beach CA of shoreline (a) untreated wastewater concentration D, (b) hourly beach visitors and swimmers N swim and (c) hourly ill swimmers N ill for the four scenarios. Panels (a and c) colors correspond to the four scenarios (see legend). The wet and tourist seasons are indicated with yellow and magenta bars at top of panels (b and c). In panel (a), D is extracted along the dashed line in Figure 5. Note, during most of the tourist season, Scenario B and C are nearly identical to each other (and to the Baseline) leading to indistinguishable lines. Similarly during the wet season, Scenario A results in only slightly lower D and N ill relative to the Baseline which is nearly indistinguishable.
