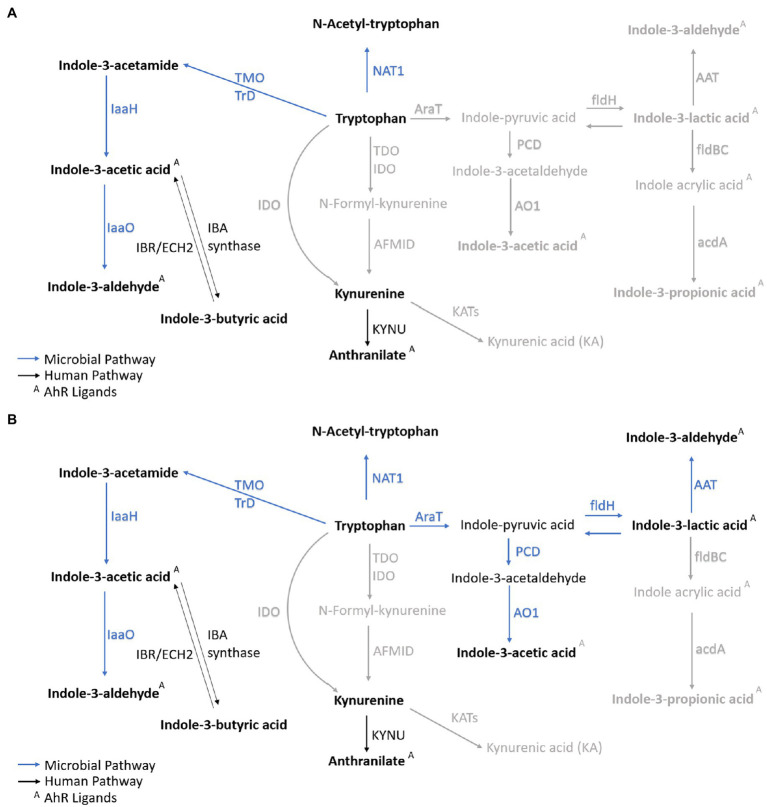
Figure 5.
Metabolic profile of VD and CD neonates. Correlated metabolites (p<0.01 and/or p<0.001) in VD neonates (A) and CD neonates (B) are marked in bold. Nonsignificant correlations are marked in gray. The microbial catabolites with significant correlations are highlighted in dark blue. The host metabolism products are marked in black. ArAT, aromatic amino acid aminotransferase, AAT, aromatic amino acid transferase, acdA, acyl-CoA dehydrogenase, AFMID, kynurenine formamidase, AO1, indole acetaldehyde oxidase, ECH2, enoyl-CoA hydratase-2, fldH, phenyl lactate dehydrogenase, fldBC, phenyl lactate dehydratase, IDO, indoleamine-2,3-dioxygenase, IaaH, indole acetamide hydrolase, IaaO, indole-3-acetic acid oxidase, KYNU, kynureninase, KAT, kynurenine amino transferase, MAO, monoamine oxygenase, NAT1, arylamine N-acetyltransferase 1, porB,C, pyruvate ferredoxin oxidoreductase B and C, PCD, pyruvate decarboxylase, TDO, tryptophan-2,3-dioxygenase, TMO, tryptophan-2-monooxygenase, TrD, tryptophan decarboxylase.

