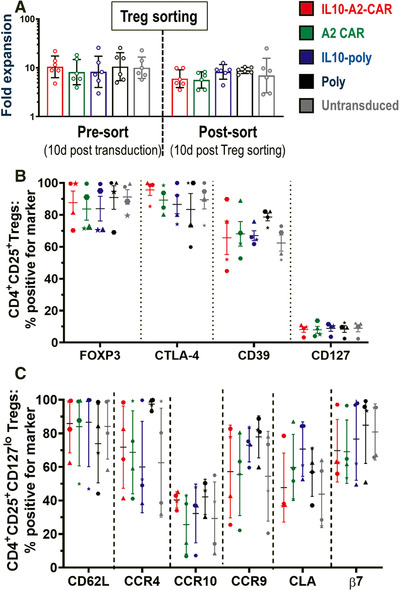
Figure 2.

Expansion capacity and phenotypes of differently transduced Tregs. (A) Expansion capacity of indicated Treg types after transduction (days 0–10; left) and after FACS sorting (days 10–20; right) and compared to mock‐treated untransduced cells (gray). Geometric means and SD of n = 6 different Treg batches (different donors, one donor per experiment) are shown. No significant differences were found between Treg types neither before (p = 0.9840) nor after FACS sorting (p = 0.5445; both by one‐way ANOVA); however, expansion slowed across Treg types after FACS (p = 0.0340; two‐way ANOVA with Tukey's multiple comparison correction). (B) Different Treg types (colors as in (A)) were analyzed for expression of indicated markers. Cells were first gated on CD4+CD25+. (C) Phenotypic marker analysis as in (B) but based on gating on CD4+CD25+CD127lo cells (cf. CD127 marker in (B)). For both (B) and (C), cells were analyzed on day 20. Each individual data point belongs to one Treg batch/donor (symbol shapes identify donors). Error bars are mean ± SD from n = 4 different donors (one donor per experiment); no significant differences in marker expression between Treg types were found by one‐way ANOVA (one test per marker with Tukey's multiple comparison correction).
