Figure 3.

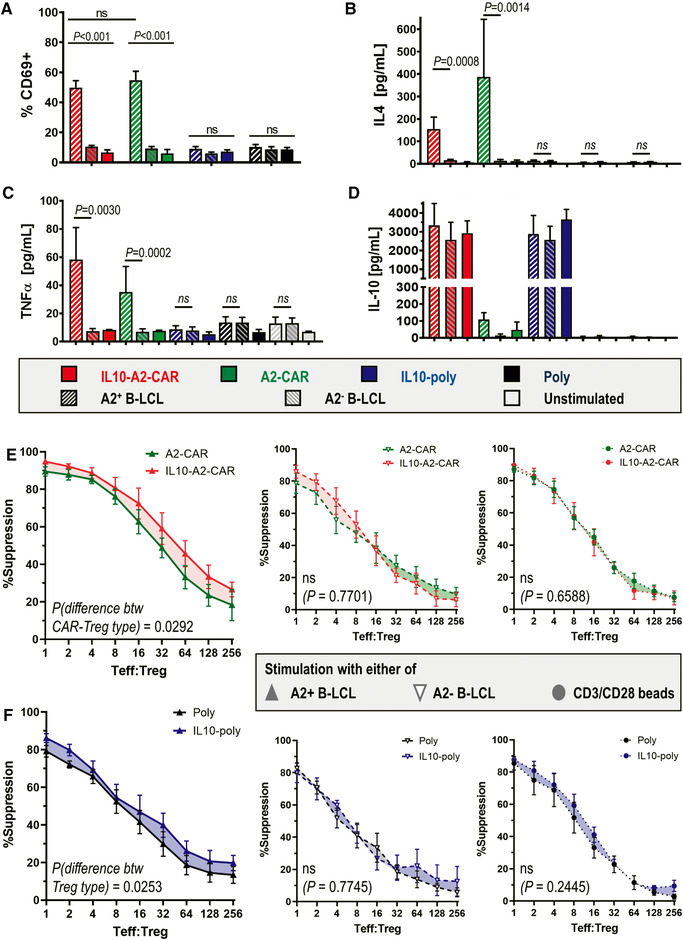
Activation and suppression capacity of differently transduced Tregs. (A) Transduced Tregs were cultured with indicated B‐LCL for 18 h before being harvested and stained for anti‐CD69. Cumulative data are shown from n = 8 different Treg batches (donors; one donor per experiment). Representative flow cytometry plots are shown in Supporting Information Fig. S4. (B–D) From experiments in (A), culture supernatants were collected and indicated cytokines were analyzed. Error bars represent SEM, n = 6 donors (one donor per experiment). Relative differences between treatments with A2+ or A2− B‐LCL were analyzed by ratio paired t‐test for each Treg type. (E and F) Indicated Treg types with or without IL‐10 co‐expression were compared. Cells were co‐cultured with dye‐labeled Teffs and indicated B‐LCL for 5 days at indicated Teff:Treg ratios (cf. Materials and Methods section). Suppression of Teff proliferation was measured by Teff label dilution using flow cytometry. Shown is the suppression of Teff proliferation by Tregs stimulated with either A2+ or A2− B‐LCL. Large panels (left column, large) show the comparison of IL‐10‐expressing Tregs and corresponding Tregs without IL‐10 co‐expression in the presence of A2+ B‐LCLs. The other panels are controls whereby (middle column) show the same comparison in the presence of A2− B‐LCLs and (right column) when B‐LCLs were replaced by CD3/CD28 activation beads. Data are from n = 6 different Treg batches (donors; one donor per experiment). Statistical analysis was performed by mixed‐model two‐way ANOVA with matched pairs per donor batch with p‐values added to figure panels.
