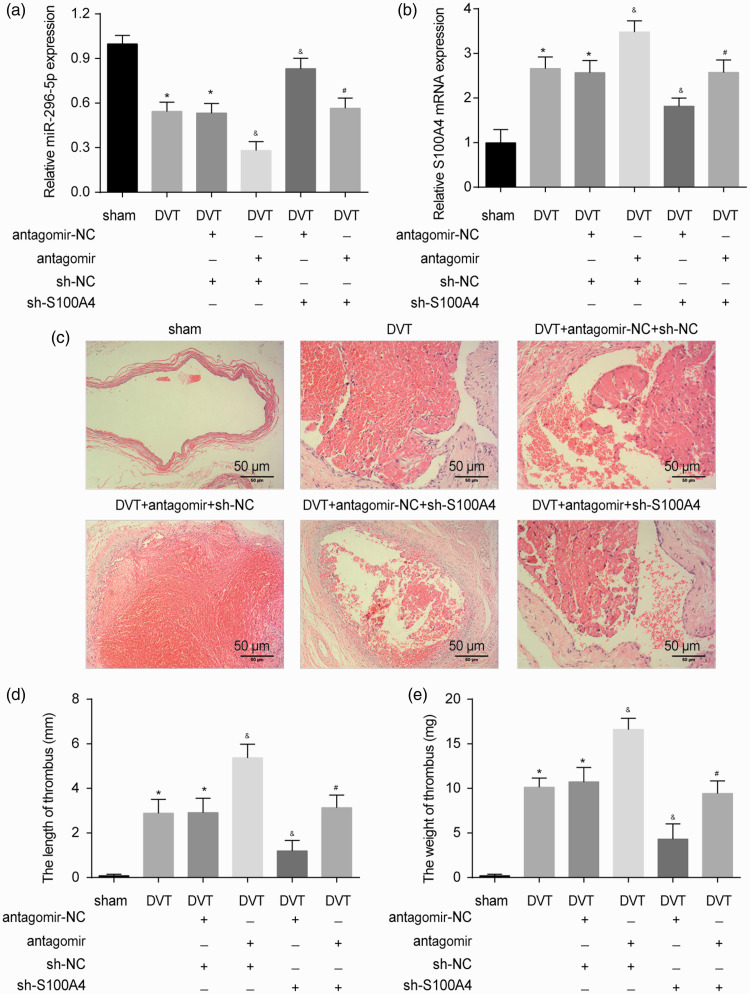
Figure 6.
Role of the miR-296-5p/S100A4 axis in DVT formation. (a–b) The expression of miR-296-5p and S100A4 in vein tissue was detected by qRT-PCR. (c) H&E staining of IVCs from sham mice, DVT mice, and DVT mice treated with the miR-296-5p antagomir or sh-S100A4. (d–e) Thrombus length and weight of IVC (n = 10 per group). *P < 0.05 vs. sham; &P < 0.05 vs. DVT+antagomir-NC+sh-NC; #P < 0.05 vs. DVT+antagomir+sh-NC. (A color version of this figure is available in the online journal.)

