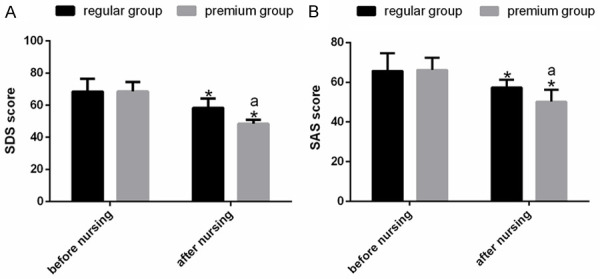
Figure 2.

Comparison of the negative emotion scores. A. Comparison of the SAS scores between the two groups before and after the nursing. B. Comparison of the SDS scores between the two groups before and after the nursing. Note: *P<0.05 vs. before the nursing; aP<0.05 vs. the regular group.
