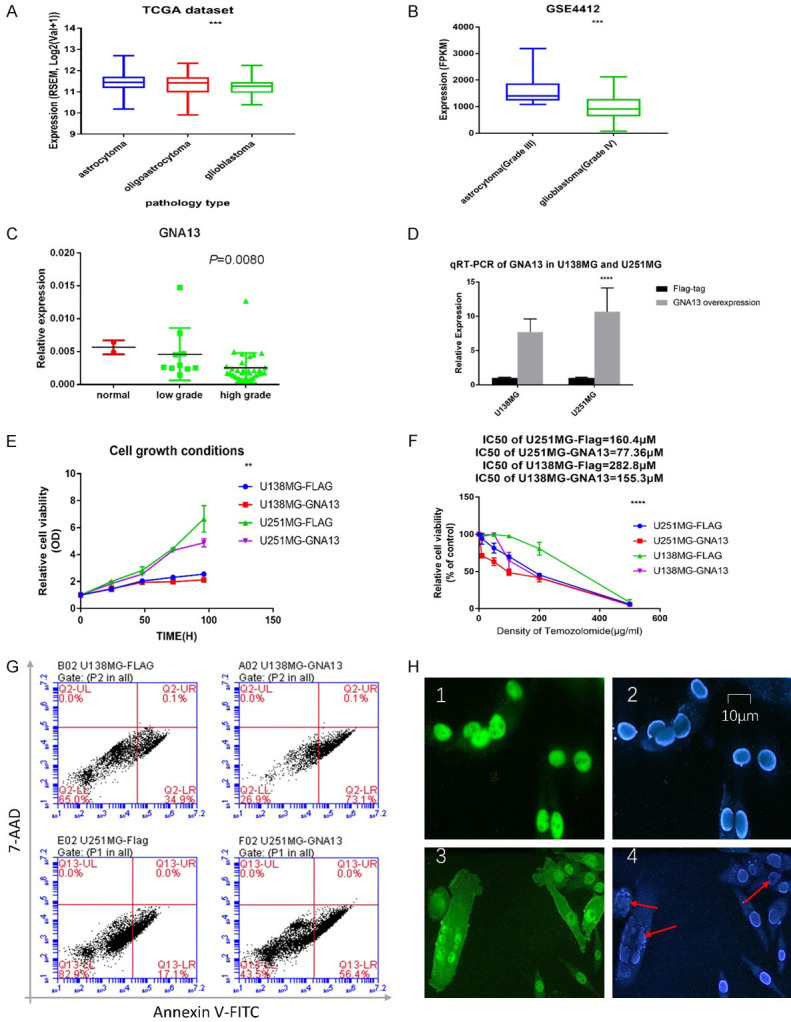
Figure 1.

Basic bioinformation of GNA13 in datasets and glioma cell lines. A. The mRNA level of GNA13 is inversely correlated with tumor grade in TCGA datasets and. B. The mRNA level of GNA13 is inversely correlated with tumor grade in GSE4412. C. GNA13 is inversely correlated to glioma grade at mRNA level, as proven by qRT-PCR. D. The GNA13-overexpressed cell lines were confirmed through qRT-PCR. E. Cell growth inhibition is observed in GNA13-overexpressed cell lines when compared with the cell growth of vector cell lines, both U138MG and U251MG were significantly inhibited while GNA13 was overexpressed (P<0.01). F. The relative cell viability is significantly decreased in GNA13-overexpressed glioma cells after TMZ treatment (P<0.01). G. 24 hours after TMZ treatment, the proportion of cells at end stage apoptosis or dead was seen to be significantly increased in the GNA13-overexpressed group (P<0.01). X axis represented the conditions of Annexin V-FITC incubated shown in 575 nm light while Y axis represent the 7-AAD incubated shown in 488 nm light. H. 24 hours after TMZ treatment, the proportion of karyorrhexis occurrence was significantly increased in the GNA13-overexpressed group (P<0.01). Green represented the GNA13 expressed conditions, blue means the nucleus staining by DAPI and red arrow was used for emphasizing the karyorrhexis.
