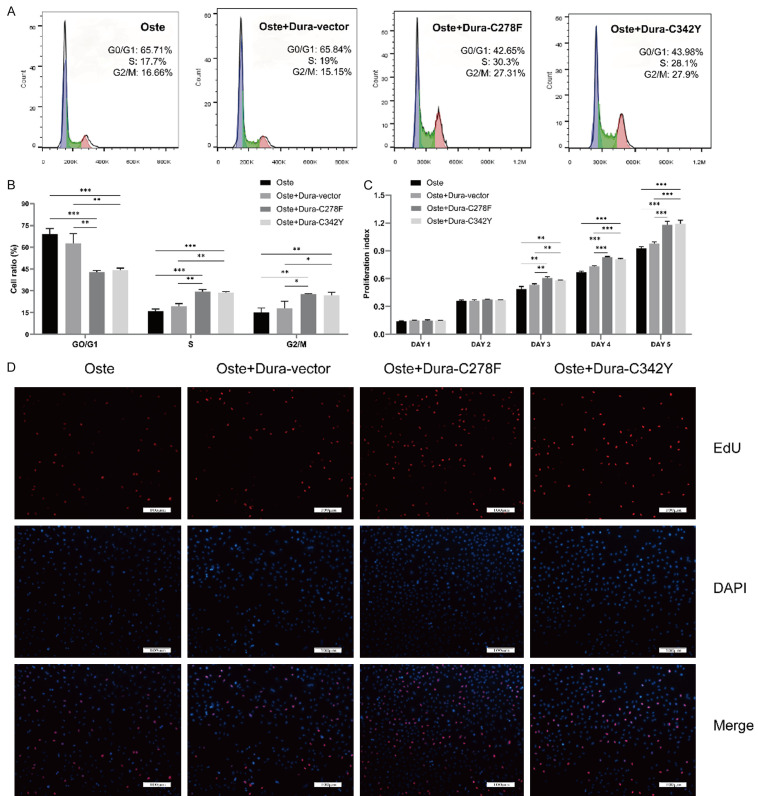
Figure 2.
The effects of the FGFR2 overexpression on the proliferation capacities of the osteoblasts co-cultured with dura cells. A. Evaluation of the cell cycle in the different groups using FACS. B. Different phases of the cell cycle in the Oste, Oste+Dura-vector, Oste+Dura-C278F, and Oste+Dura-C342Y groups. C. A CCK-8 assay was further performed to evaluate the osteoblast proliferation index (day 1 to day 5). D. Representative immunofluorescence micrographs of EdU staining visually showed the overall proliferation levels of the osteoblasts in the different groups. The red color showed the EdU positive staining of the proliferating cells, and the blue color showed the cell nuclei stained with DAPI. The percentages of positive cells with EdU staining were: 50.2443±13.4780 (Oste), 53.6011±15.3552 (Oste+Dura-vector), 78.8621±8.4261 (Oste+Dura-C278F), and 82.1183±14.8147 (Oste+Dura-C342Y), which had significant differences (Oste+Dura-C278F vs. Oste, P<0.05, Oste+Dura-C342Y vs. Oste, P<0.05). The values were measured as the means ± SD, *P<0.05, **P<0.01, ***P<0.001.

