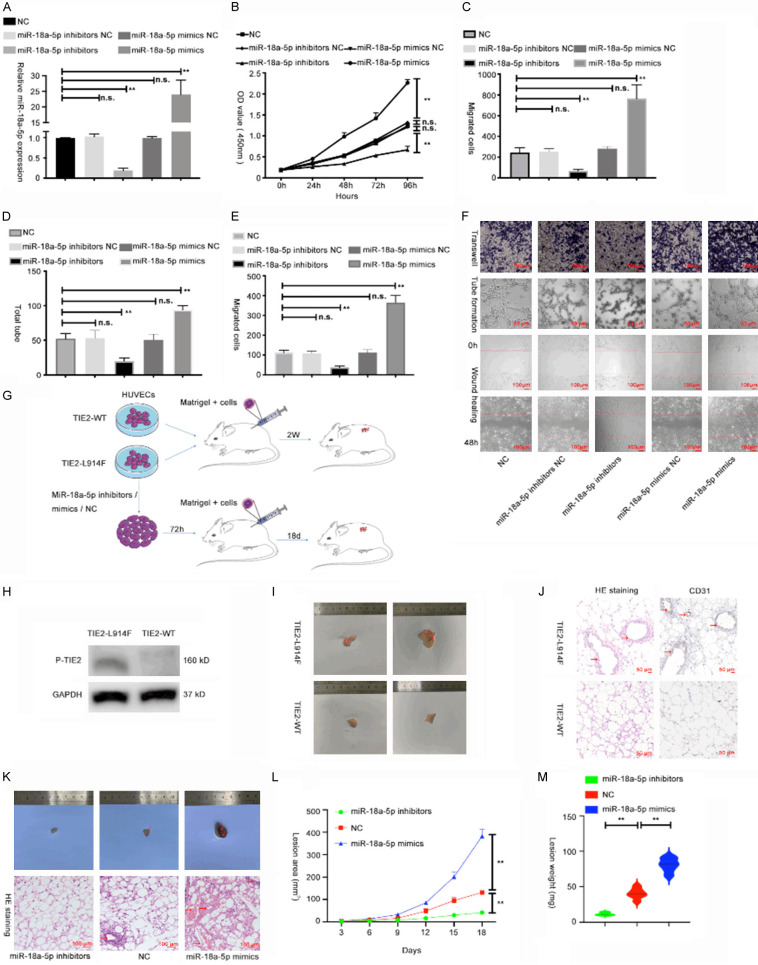
Figure 2.
MiR-18a-5p promoted cell proliferation, invasion, migration and angiogenesis of HUVECs in vitro and in vivo. (A) MiR-18a-5p expression was measured via qRT-PCR in HUVECs transfected with plasmids for 48 h. (B) Cell viability was measured by CCK-8 assay in HUVECs transfected with miR-18a-5p inhibitors, miR-18a-5p mimics or corresponding NCs. (C-F) Results of transwell (C, up F), tube formation (D, middle F), and wound healing assays (E, down F) in HUVECs transfected with miR-18a-5p inhibitors, miR-18a-5p mimics or corresponding NCs. (G) Schematic diagram: establishment and treatment of the VM mouse model. (H) The phosphorylated TIE-2 level was detected by Western blot assay. (I) The lesions were harvested 2 weeks after inoculation. (J) H&E and CD31 staining of the lesions. (K) Lesions and H&E staining at 18 days after inoculation of VM model mice subjected to different treatments. (L) Growth curve of the lesion area shows the speed of VM mass growth. (M) The weight of masses excised from mice in the ectopic expression and vector groups were measured and analyzed. The relative expression fold changes in mRNA expression were calculated by the 2-ΔΔCt method. Data were obtained from three independent repeated experiments. **P<0.05; n.s.: not significant.

