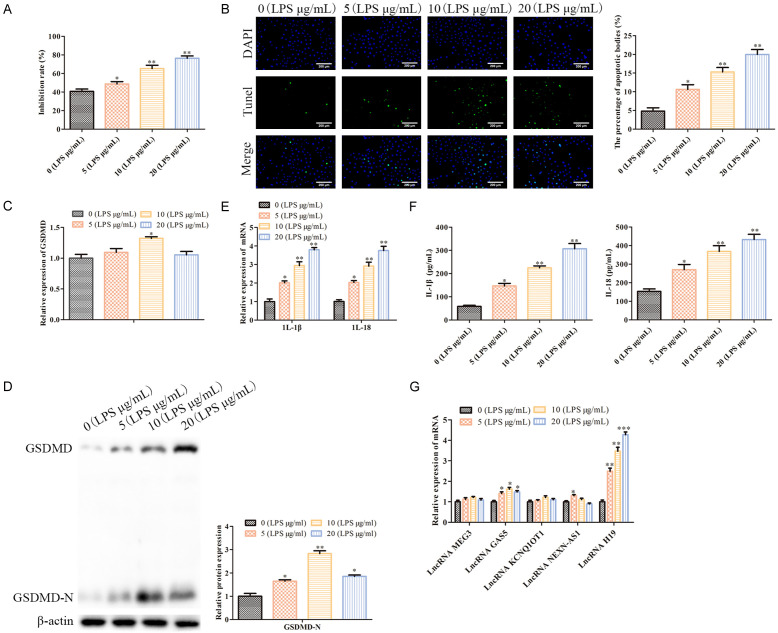
Figure 1.
LPS induces a pneumonia model in vitro. A: MTT assays were conducted to evaluate the cell proliferation; *P<0.05, **P<0.01, vs. 0 (LPS μg/mL). B: TUNEL staining (100×) was performed to assess the cell pyroptosis; *P<0.05, **P<0.01, vs. 0 (LPS μg/mL). C: RT-PCR was carried out to determine the GSDMD mRNA levels in the WI-38 cells; *P<0.05, vs. 0 (LPS μg/mL). D: Western blot analysis was conducted to measure the GSDMD-N protein expressions in the WI-38 cells. *P<0.05, **P<0.01, vs. 0 (LPS μg/mL). E: RT-A PCR analysis was performed to measure the mRNA levels of the IL-1β and IL-18 genes in the WI-38 cells. *P<0.05, **P<0.01, vs. 0 (LPS μg/mL). F: ELISA assays were carried to assess the IL-1β and IL-18 levels in the WI-38 cell supernatant. *P<0.05, **P<0.01, vs. 0 (LPS μg/mL). G: An RT-qPCR analysis was performed to measure the mRNA levels of the LncRNAs which are related to the pyroptosis, including LncRNA MEG3, LncRNA GAS5, LncRNA kcnq1ot1, LncRNA NEXN-AS1 and LncRNA H19. *P<0.05, **P<0.01, ***P<0.001, vs. 0 (LPS μg/mL).

