
Figure 3.
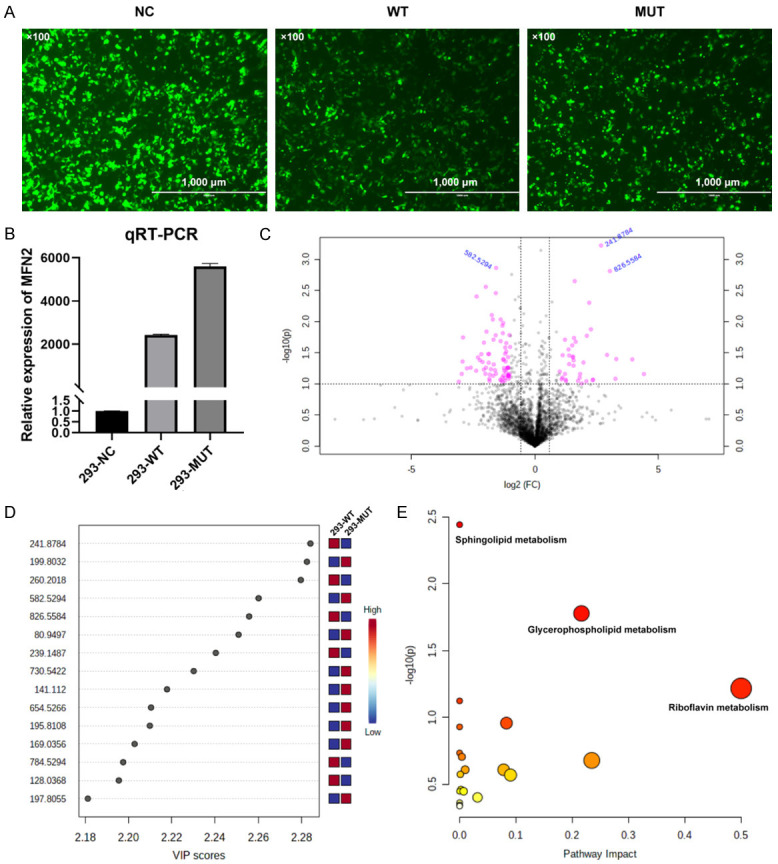
A. The GFP fluorescence signal at 48 h after transfection. NC, with plasmid backbone; WT, with wild-type MFN2 cDNA; MUT, with MFN2: c.638T>C mutant cDNA. (Scale bar, 1000 μ; magnification: ×100). B. The relative MFN2 expression levels in 3 transfected cell groups. C. The volcano plot showing significantly different compounds. Red dots represent the difference >2.0 folds and P<0.05, blue font represents the m/z molecular weight information. D. Part of the compounds with vip (variable importance in projection) value >1. The X- and Y-axes stand for vip score and m/z, respectively. E. KEGG pathway enrichment result. Each point represents a pathway, with X- and Y-axes indicating the importance of a compound related to the pathway and-log10(P) value, respectively.