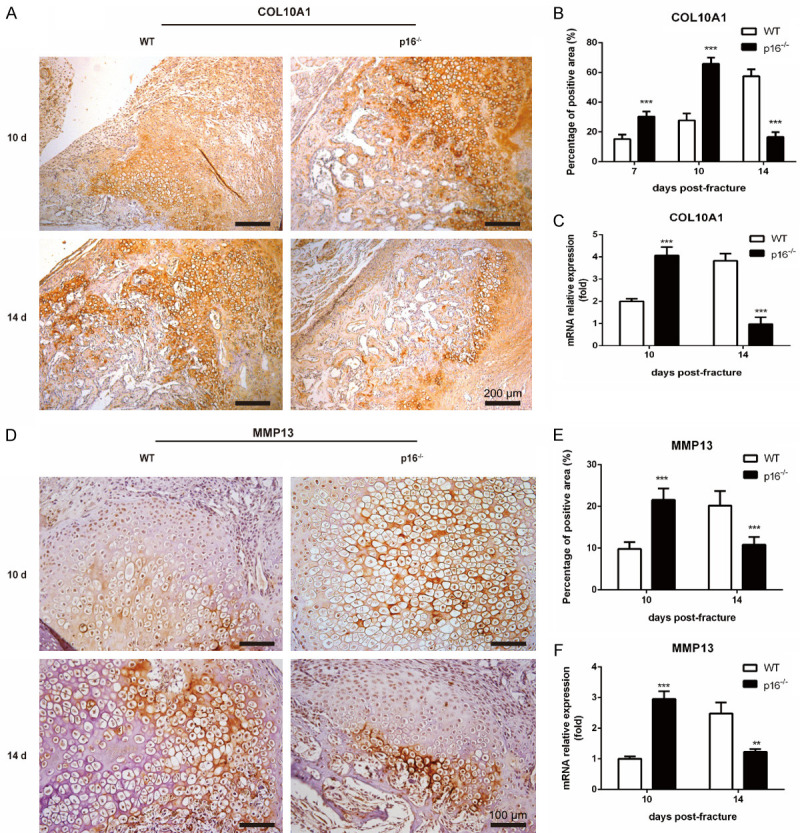
Figure 5.

Deletion of p16 promoted chondrocyte maturation. Representative immunohistochemical micrographs of (A) COL10A1, a specific marker of hypertrophic chondrocytes and (D) MMP13 in callus on postoperative days 10 and 14. The percentages of (B) COL10A1-positive and (E) MMP13-positive areas in callus on postoperative days 10 and 14. The mRNA levels of (C) COL10A1 and (F) MMP13 in callus on postoperative days 10 and 14 were measured by qRT-PCR, calculated as ratio relative to GAPDH mRNA and expressed relative to WT. n=4, **P<0.01, ***P<0.001, compared with WT mice.
