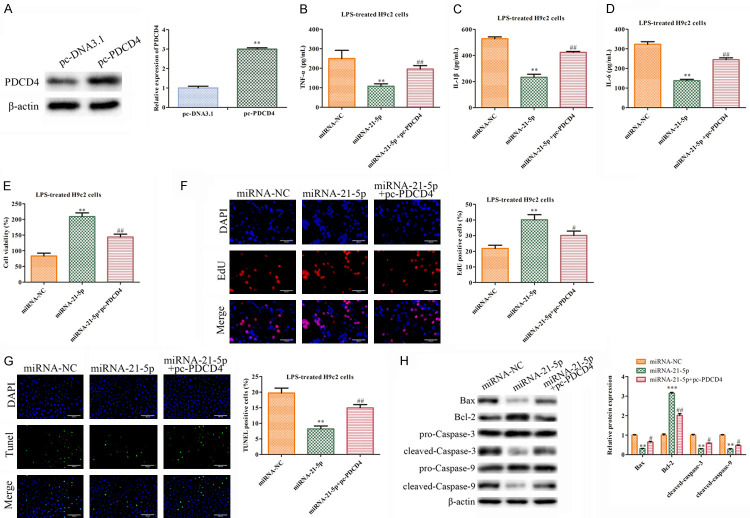
Figure 4.
The function of the miR-21-5p inhibitor is reversed by pc-PDCD4 in the LPS-treated H9c2 cells. A. The protein levels of PDCD4 were measured using western blot. The values are the mean ± SD, **P<0.01 vs. pc-DNA3.1. n=3 per group. The LPS-treated H9c2 cells transfected with miR-NC, miR-21-5p mimics or miR-21-5p mimics + pc-PDCD4. B-D. We used ELISA to measure the secretions of cytokines TNF-α, IL-1β, and IL-6. **P<0.01 vs. miRNA-NC group, ##P<0.01 vs. miRNA-21-5p group. E. The cell viability was measured using CCK-8 assays. **P<0.01 vs. the miRNA-NC group, ##P<0.01 vs. the miRNA-21-5p group. F. We used an EdU assay to analyze the cell proliferation (400×). **P<0.01 vs. the miRNA-NC group, #P<0.05 vs. miRNA-21-5p group. G. We used a TUNEL assay to analyze the apoptosis (400×). **P<0.01 vs. the miRNA-NC group, ##P<0.01 vs. miRNA-21-5p group. H. A Western blot analysis of the expression levels of the proteins. The values are the mean ± SD. **P<0.01, ***P<0.001 vs. miRNA-NC group, #P<0.05, ##P<0.01 vs. miRNA-21-5p group. n=3 per group.

