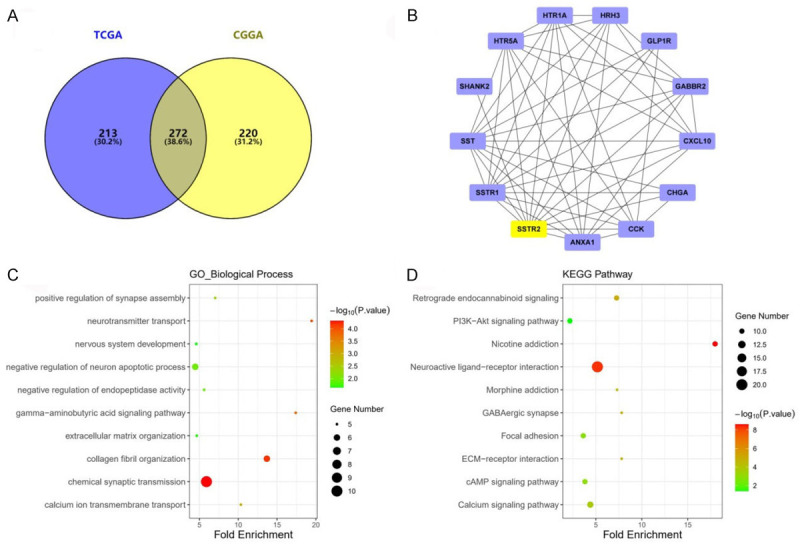
Figure 6.

Bioinformatic analysis of the SSTR2-related differentially expressed genes (DEGs) in gliomas. A. Venn diagram showing the DEGs, including 485 in the TCGA, 429 in the CGGA ,and 272 belonging to both the TCGA and the CGGA. B. Protein-protein interaction (PPI) network of SSTR2-directly related genes. C. GO pathway enrichment analysis of DEGs. D. KEGG pathway enrichment analysis of DEGs.
