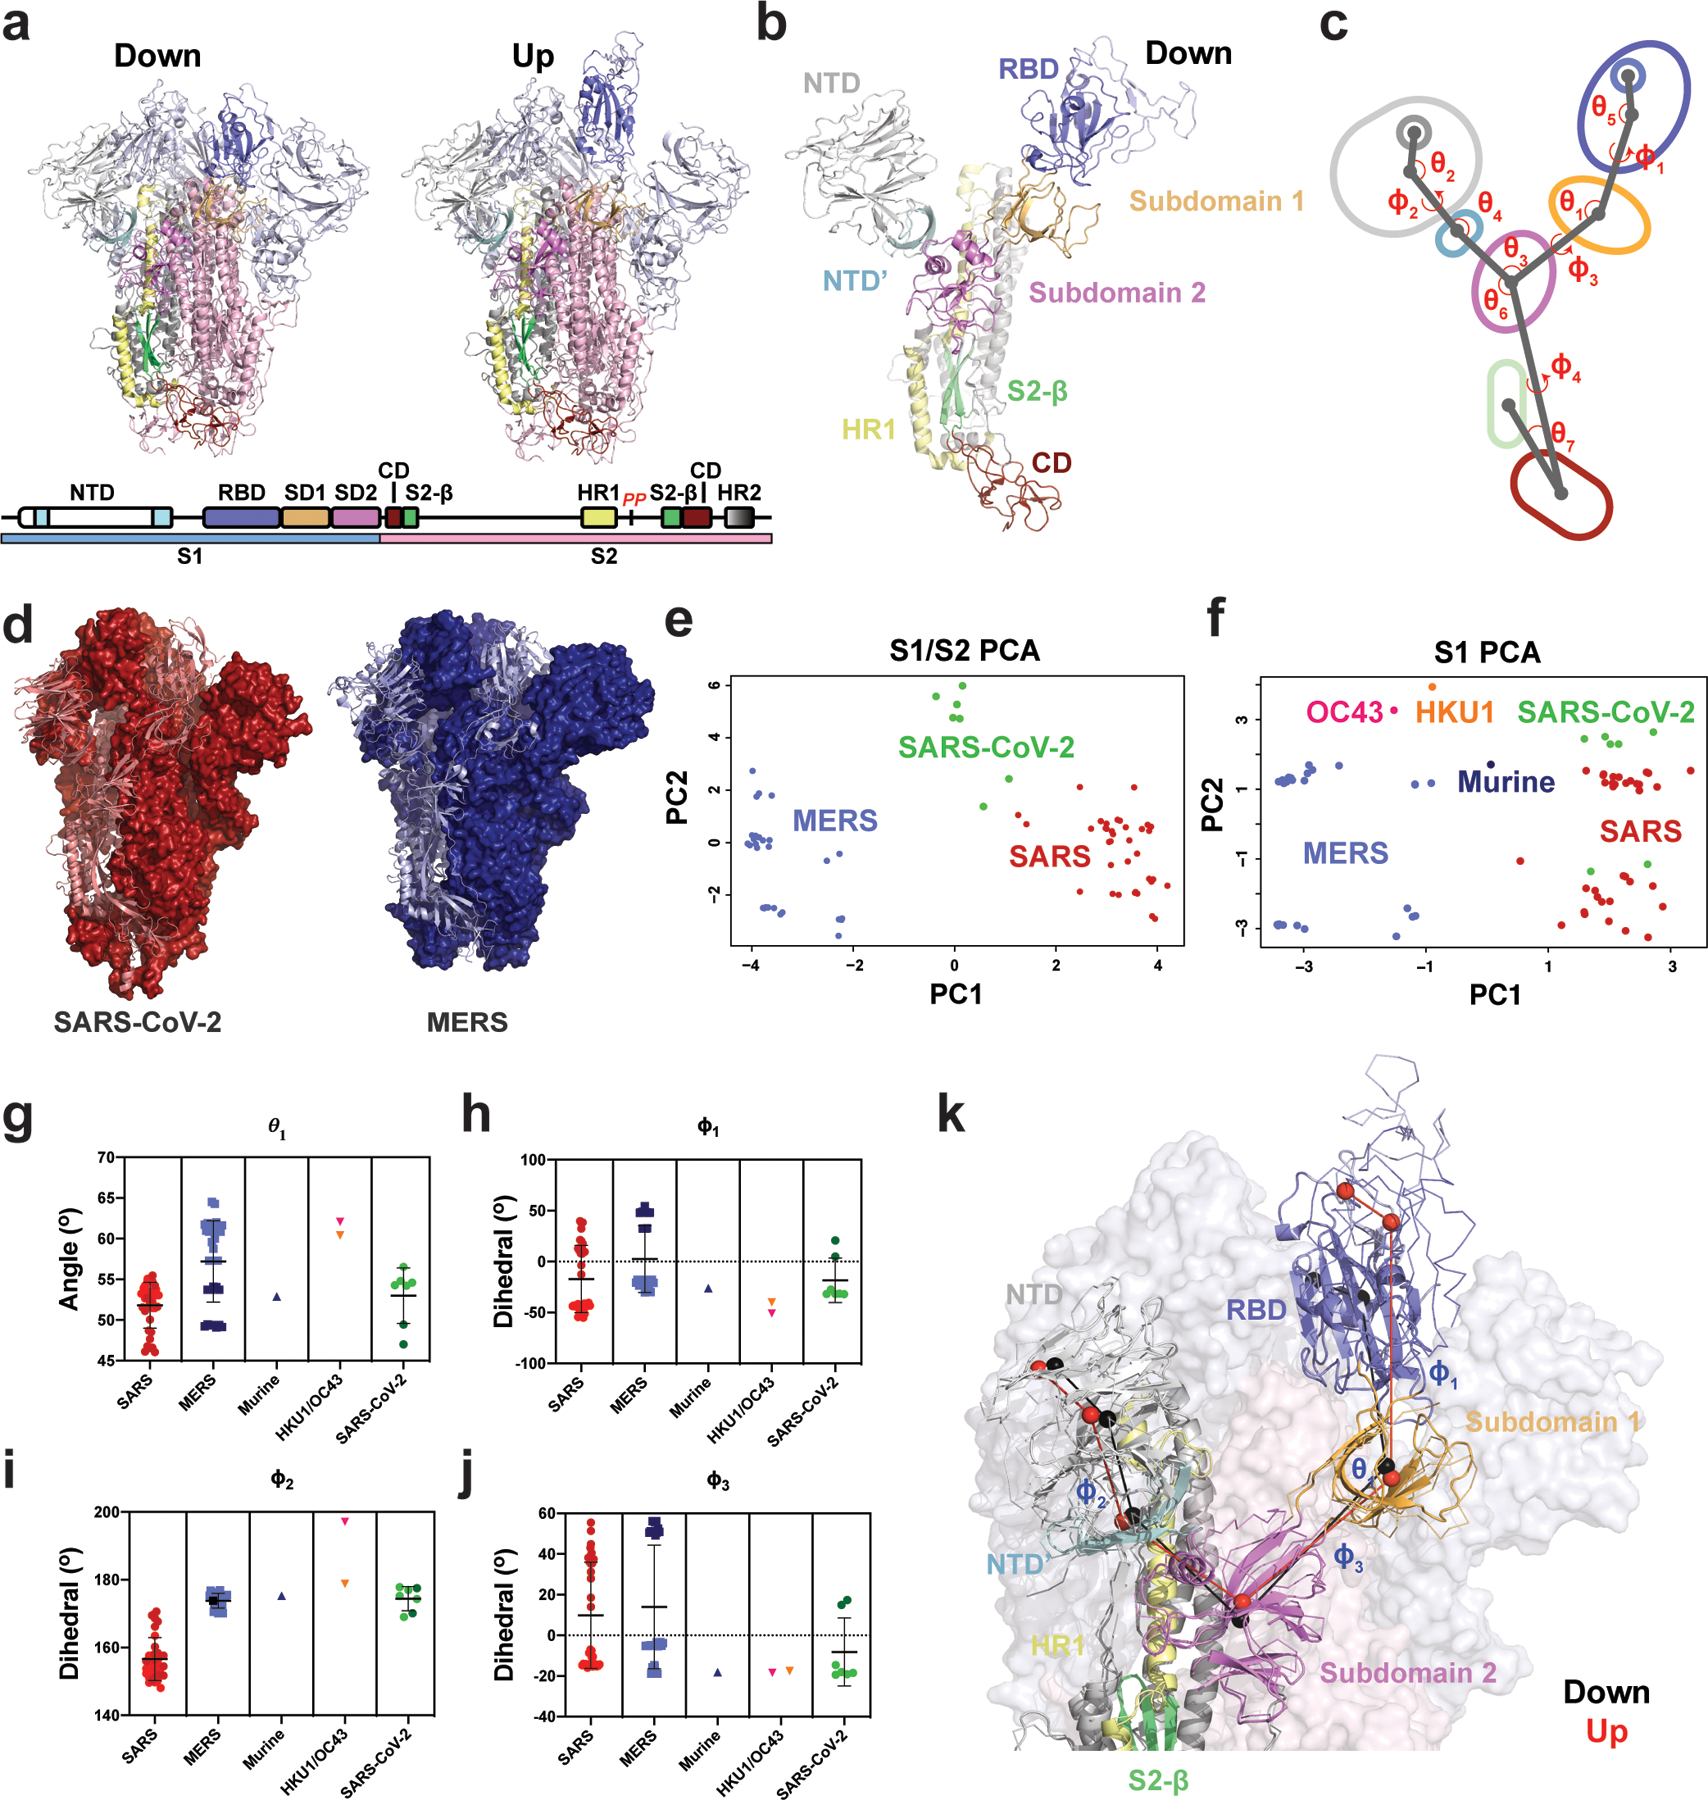
Figure 1. Vector-based analysis of the CoV S-protein demonstrates remarkable variability in S-protein conformation within ‘up’ and ‘down’ states between CoV strains.

A) Cartoon representations of ‘down’ (upper left) and ‘up’ (upper right) state SARS-2 structures (PDB 6VXX and 6VYB, respectively) colored according to the specified domains (lower). B) A single ‘down’ state protomer of the CoV S-protein with labeled domains (PDB 6VXX). The receptor binding domain (RBD) is in its ‘down’ conformation. C) A simplified diagram of the CoV S-protein depicting the centroids and vectors connecting them, with the determine angles (θ) and dihedrals (ϕ) labeled. D) The SARS-2 (left; red, PDB 6VXX) and MERS (right; blue, PDB 6Q04) structures, each with a single protomer depicted in cartoon representation and the remaining two in surface representation. The structures were aligned with the images captured from the same angle for visualization. E) Principal components analysis (PCA) of the SARS and MERS protomers showing measures between S1 and S2 domains. F) Principal components analysis of the SARS, MERS, HKU1, and Murine CoV protomers showing measures only between S1 domains. G) Angle between the SD2-to-SD1 vector and the SD1-to-RBD vector. H) Dihedral about the SD1-to-RBD vector. I) Dihedral about the NTD-to-NTD’ vector. The OC43 value of −162° was adjusted to 197 °(+360 °) for visualization here. J) Dihedral about the SD2-to-SD1 vector. Data points for SARS, MERS, and SARS-2 in g–j colored according to ‘up’ (dark) and ‘down’ (light) states and color code in the PCA analysis in panels e and f. Lines show mean and s.d. The PDB IDs for all structures represented in the PCA and angle/dihedral plots are listed in Supplementary Table 1. K) Structural representation of the (G)-(J) angles and dihedrals overlaid on an alignment between a SARS-2 ‘down’ (cartoon structure with black centroids and lines; PDB 6VXX) and ‘up’ (ribbon structure with red centroids and lines; PDB 6VYB) state protomer. Adjacent protomers are depicted as a transparent surface with S1 (light blue) and S2 (light pink). Source data for graphs here are in Supplementary Data 1.
