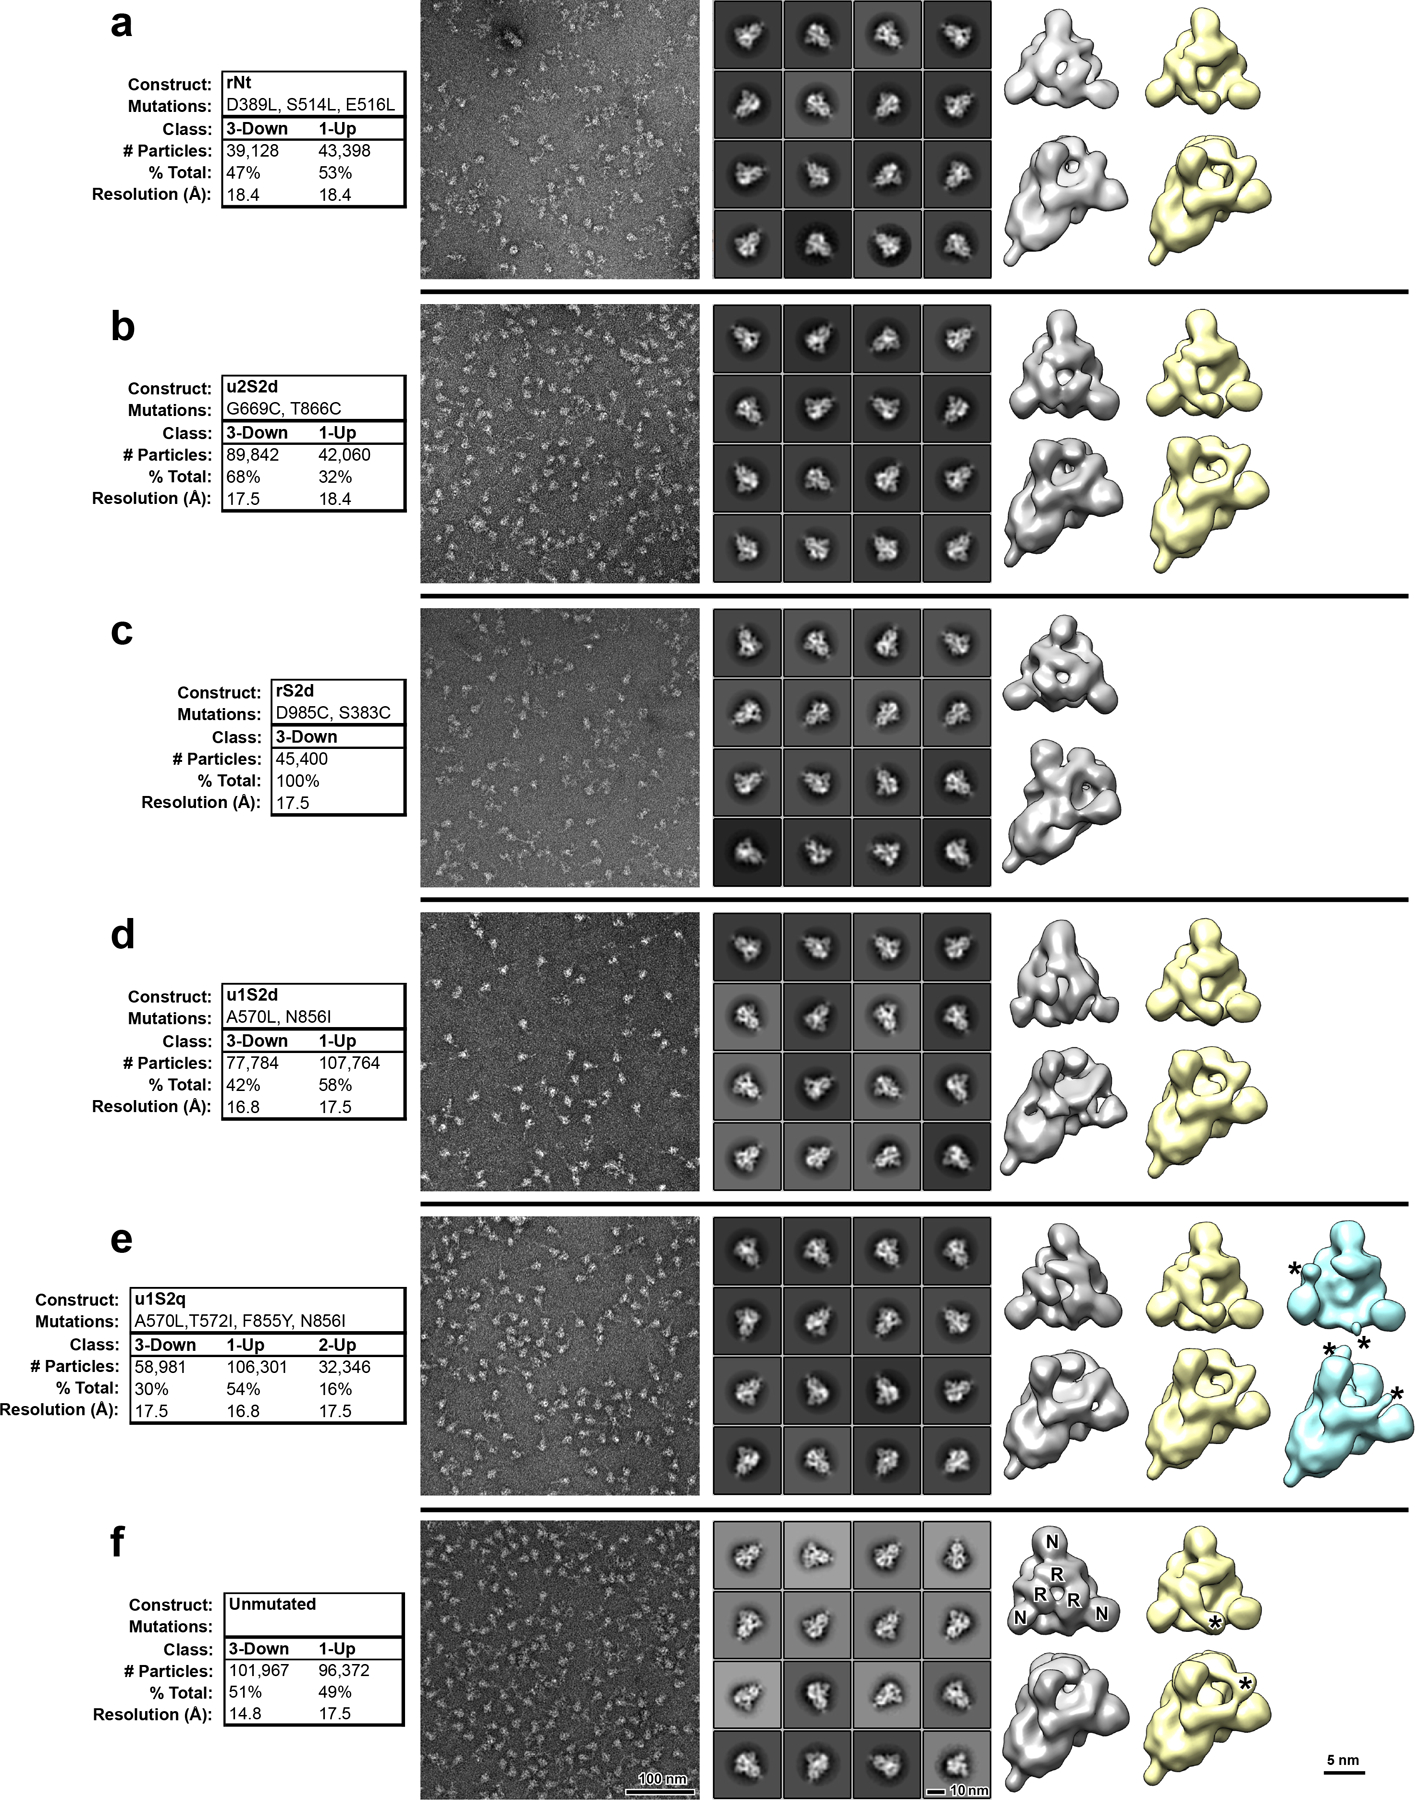
Extended Data Fig. 4. Negative stain electron microscopy analysis of S-protein constructs.

A) Data tables, indicating construct names, mutations, observed classes, number and percent of particles per class and final resolution (gold-standard Fourier-shell correlation, 0.143 level). B) Raw micrographs. C) Representative 2D class averages. D) 3D reconstructions of 3-RBD-down classes, shown in top view, looking down the S-protein 3-fold axis on the left and tilted view on the right. Receptor binding domains and N-terminal domains of first structure marked with R and N, respectively. E) 3D reconstructions of 1-RBD-up classes. Up-RBD is marked with an asterisk. F) 3D reconstruction of 2-RBD-up class. Density for up-RBDs is weak, indicated by asterisks.
