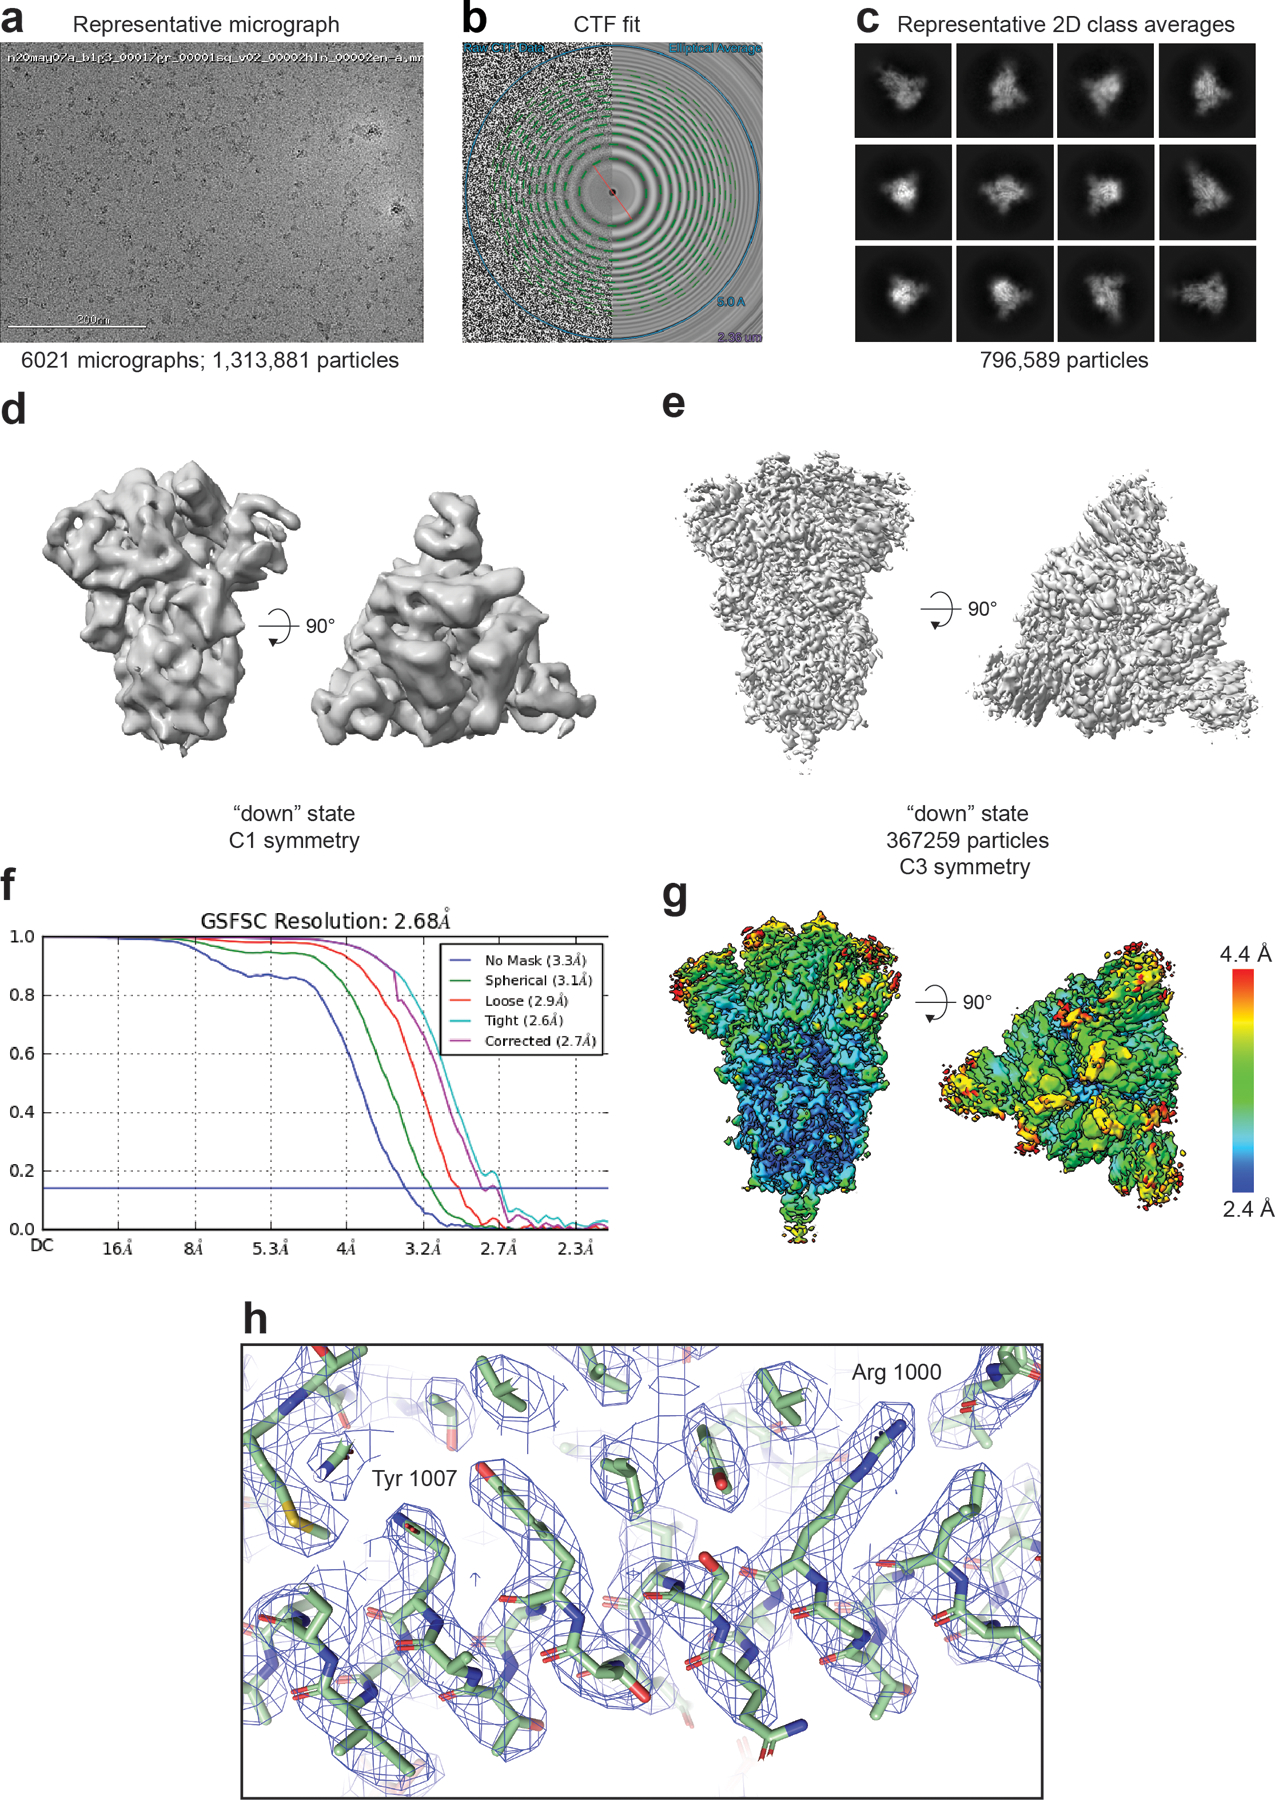
Extended Data Fig. 6. Cryo-EM data processing details for rS2d.

A) Representative micrograph. (B) CTF fit (C) Representative 2D class averages. (D) Ab initio reconstruction. (E) Refined map (F) Fourier shell correlation curves (G) Refined map colored by local resolution. (H) Zoomed-in view of the S2 region showing cryo-EM reconstruction as a transparent grey surface, the underlying fitted model in cartoon representation, and residues in ball-and-stick representation.
