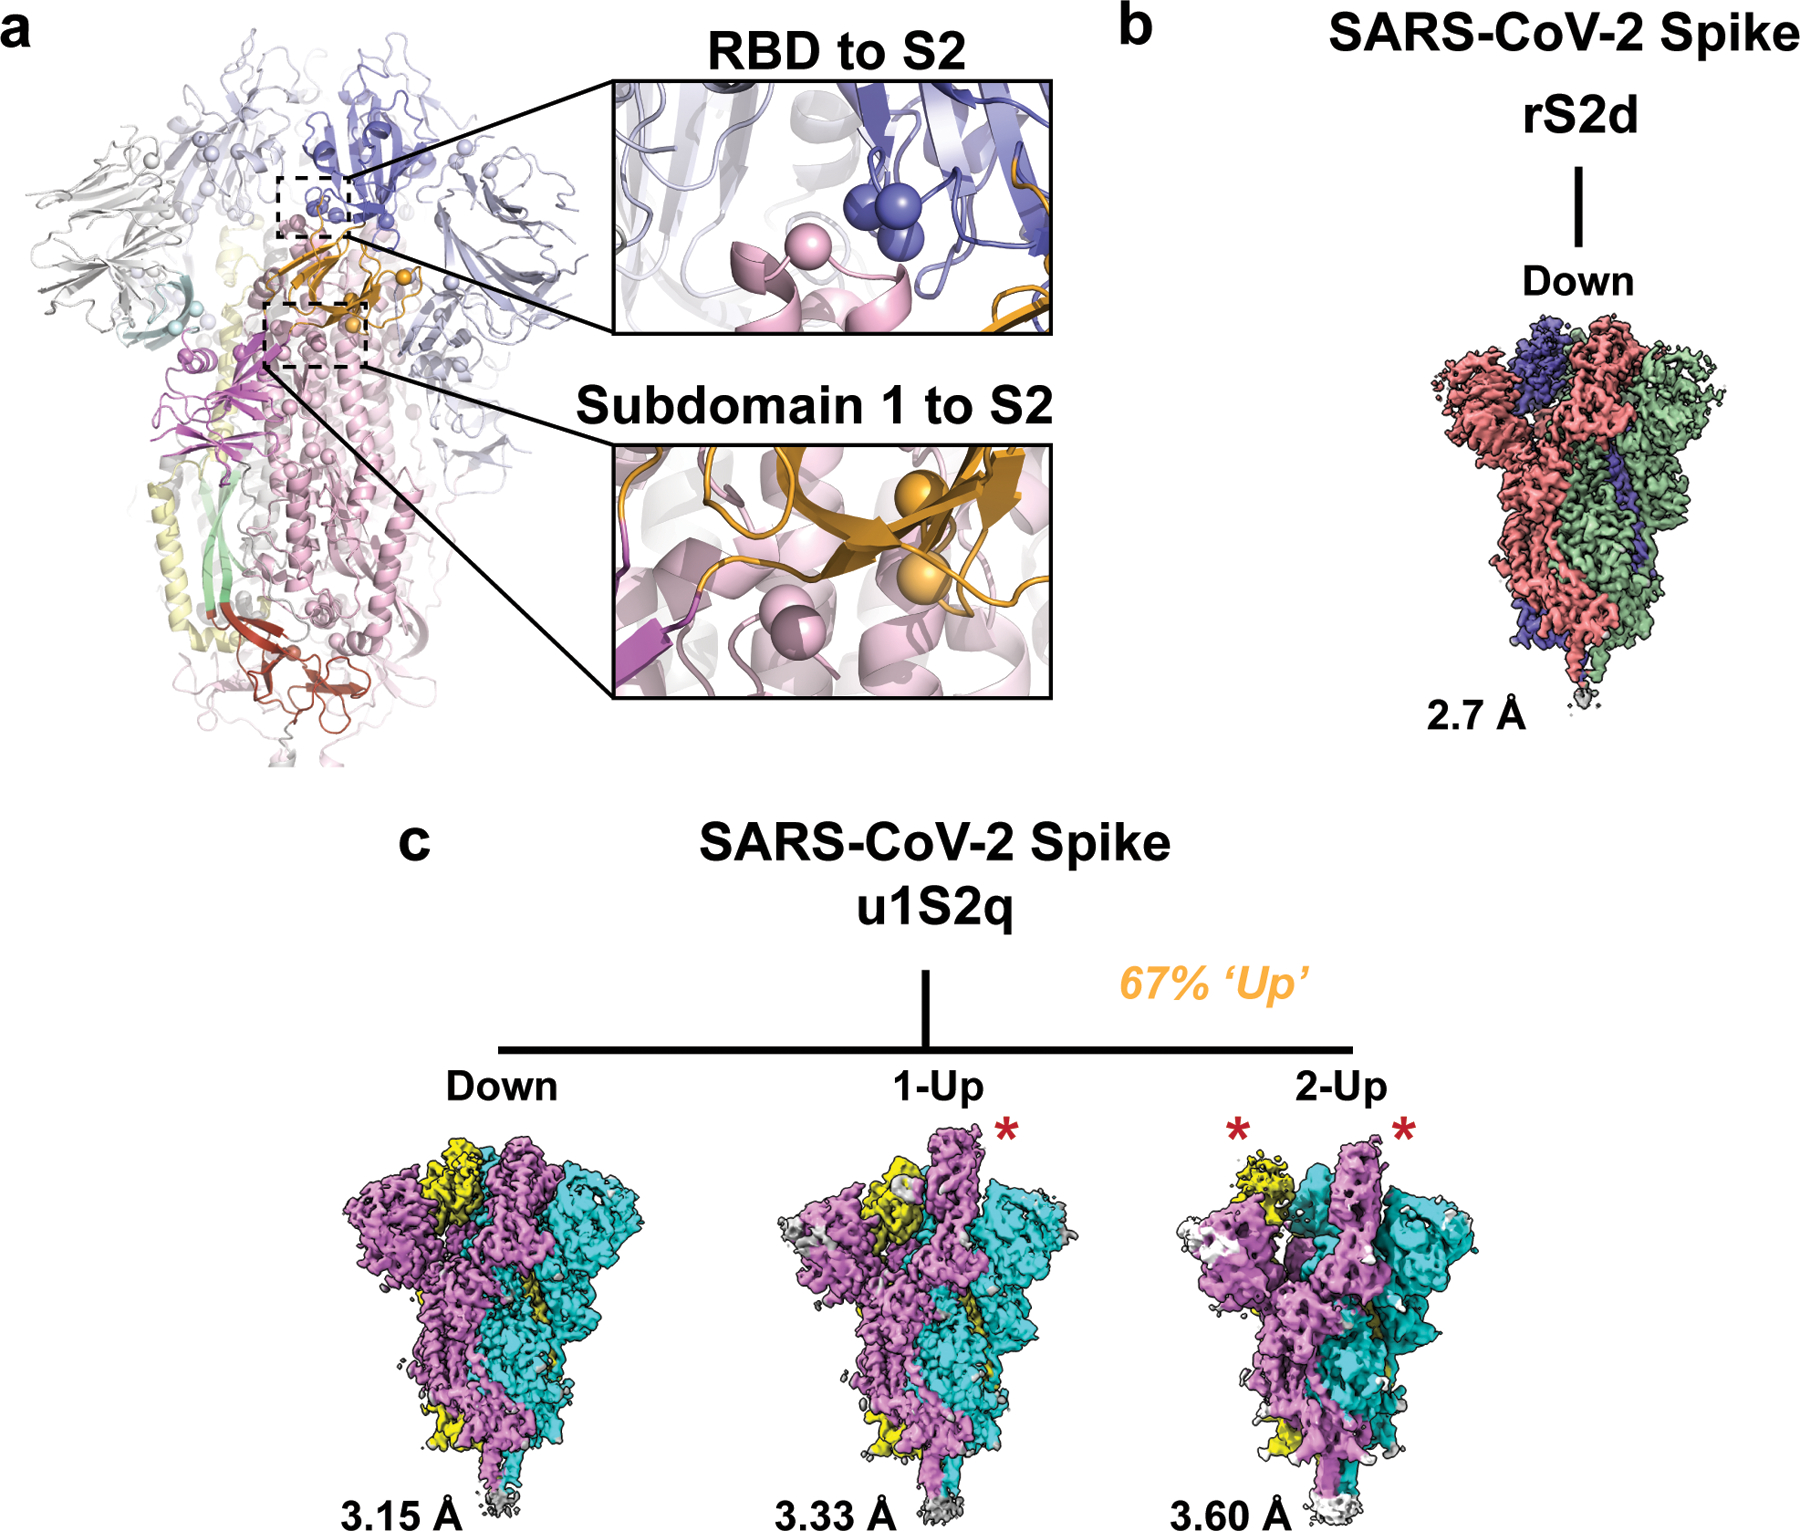
Figure 2. Cryo-EM structures reveal differential stabilization of the S-protein in the mutant ectodomain constructs.

A) The S-protein spike highlighting the two regions of interest for structure and computation-based design (PDB 6VXX). B) The rS2d RBD to S2 locked structure displaying only the all RBD ‘down’ state map. C) The u1S2q SD1-to-S2 mutated structure displaying the all RBD ‘down’ state, the 1-RBD ‘up’ state, and the 2-RBD ‘up’ state. The percentage listed in orange is the sum of particles found in either 1- or 2-RBD ‘up’ states. Each protomer in each map is colored differently with resolutions for these listed to the lower left. Red stars indicate ‘up’ state RBDs.
