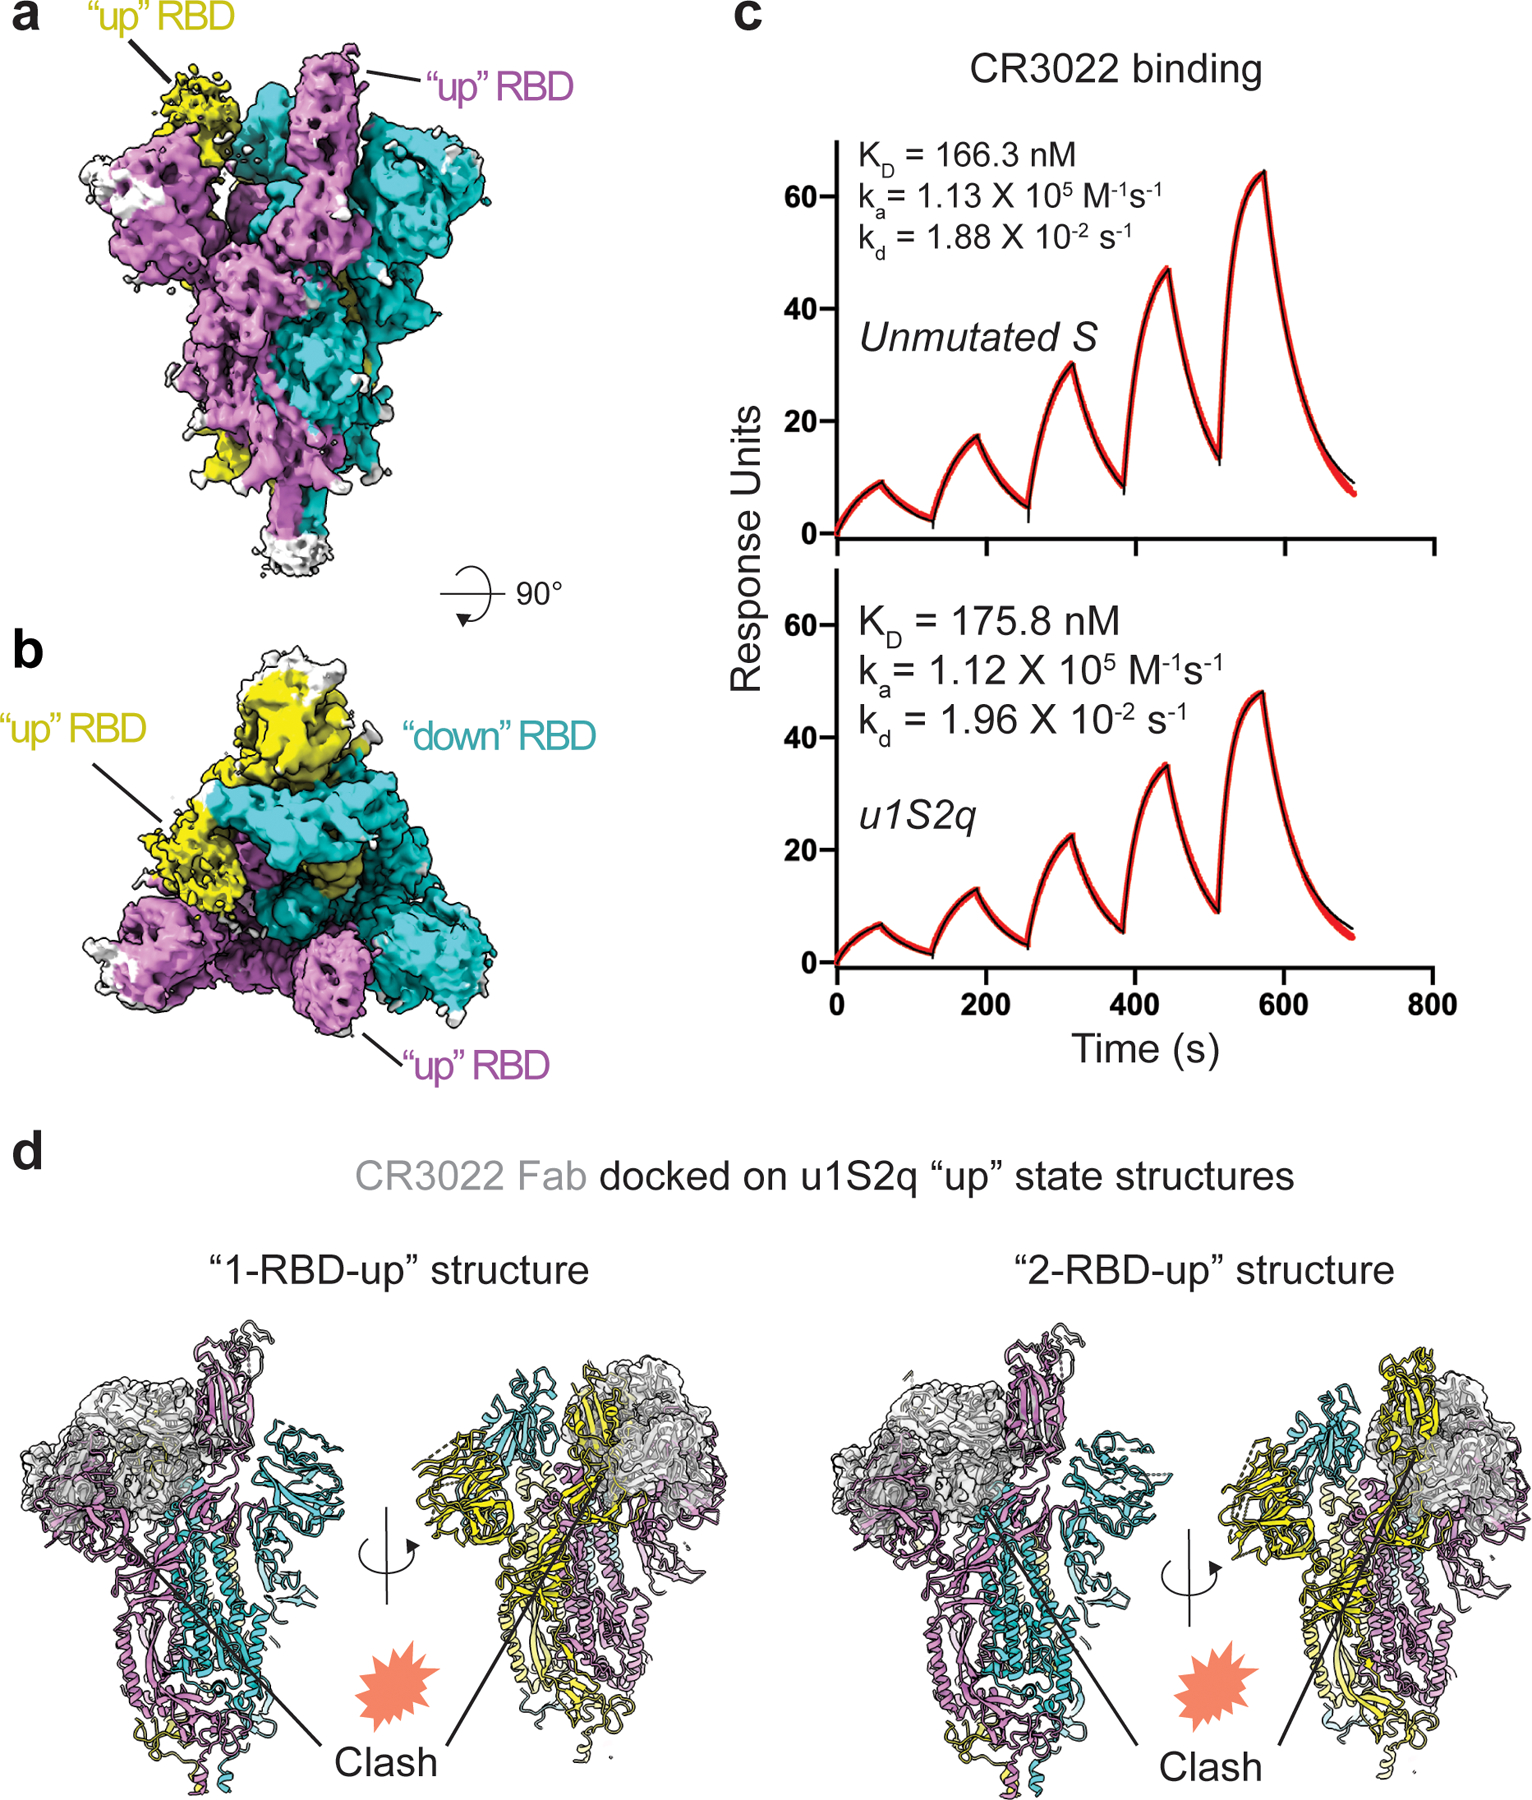
Figure 6. Structure of the u1S2q 2 RBD ‘up’ state.

A) Cryo-EM reconstruction of u1S2q colored by chain. B) ~90 rotated view of (A). C) Binding of antibody CR3022 to (top) the unmutated construct and (bottom) u1s2q. Binding of CR3022 Fab to the S proteins was measured by SPR using single cycle kinetics. The black lines are the binding sensorgrams and the red lines show fit of the data to a 1:1 Langmuir binding model. (D) CR3022 (shown as a semi-transparent, gray surface) modeled on the “1-up” u1S2q structure (left) and the “2-up” u1S2q structure (right) using RBD in the crystal structure of the CR3022-RBD complex (PDB 6W41) to superimpose on the “up” RBD of the u1S2q structures. Locations of potential clashes are indicated in each model.
