
Extended Data Fig. 1. β-CoV Vector Analysis.
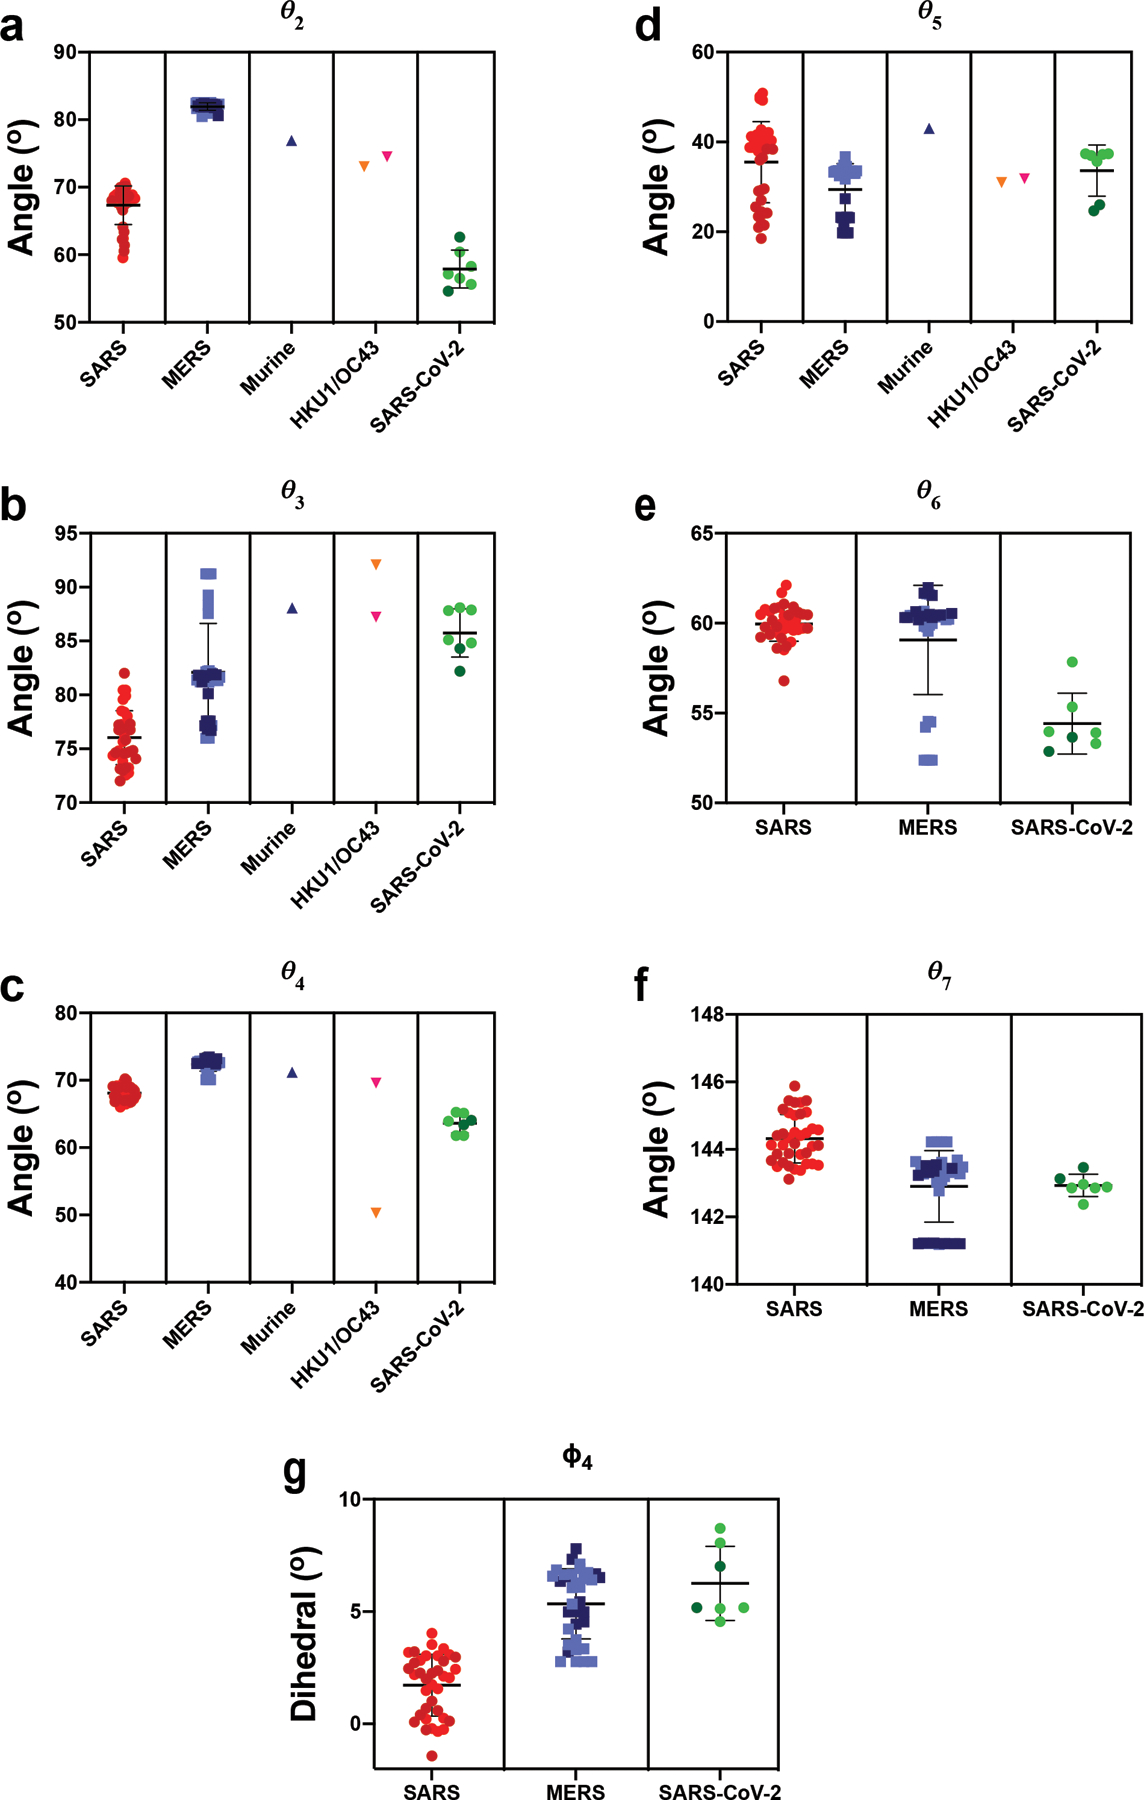
A) The angle between the vectors connecting the NTD sheet motif centroid and the NTD centroid and the vector connecting the the NTD centroid to the NTD’ centroid. B) The angle between the vectors connecting the NTD’ centroid and the SD2 centroid and the vector connecting the the SD2 centroid to the SD1 centroid. C) The angle between the vectors connecting the NTD centroid and the NTD’ centroid and the vector connecting the the NTD’ centroid to the SD2 centroid. D) The angle between the vectors connecting the SD1 centroid and the RBD centroid and the vector connecting the the RBD centroid to the RBD helix motif centroid. E) The angle between the vectors connecting the NTD’ centroid and the SD2 centroid and the vector connecting the the SD2 centroid to the CD centroid. F) The angle between the vectors connecting the SD2 centroid and the CD centroid and the vector connecting the the CD centroid to the β-sheet motif centroid. G) The dihedral about the SD2 centroid and the CD centroid. Points for SARS, MERS, and SARS-2 in Figure 1 (G)-(J) colored according to ‘up’ (dark) and ‘down’ (light) states according to the color code in the PCA analysis, panels (E) and (F). Individual data points shown as symbols; lines denote mean and s.d. The source data are available in Supplementary Data 1.