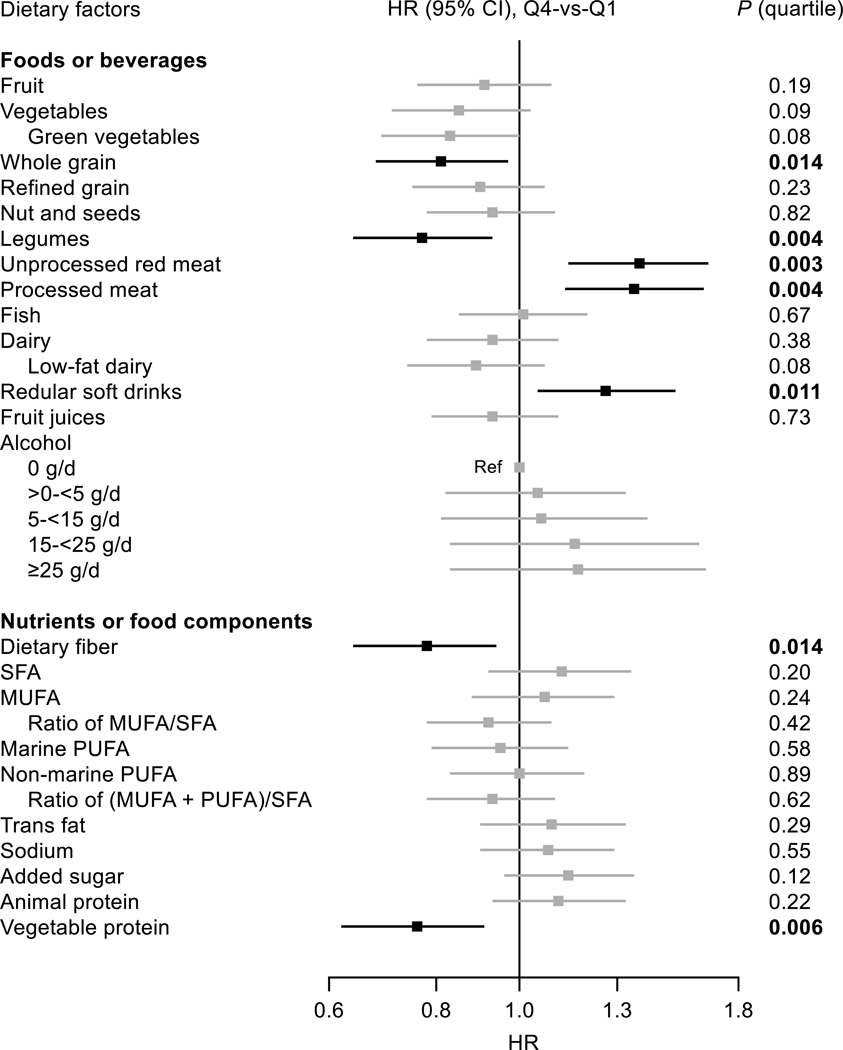
Figure. Relationship between food groups or nutrients or food components and risk of peripheral arterial disease in the Women’s Health Initiative (n = 138 506).
Where appropriate, results were adjusted for covariates listed for model 2 of Table 2. P values are P for trend across quartiles of the intakes. MUFA indicates monounsaturated fatty acids; PUFA, polyunsaturated fatty acids; Q, quartile; and SFA, saturated fatty acids.

