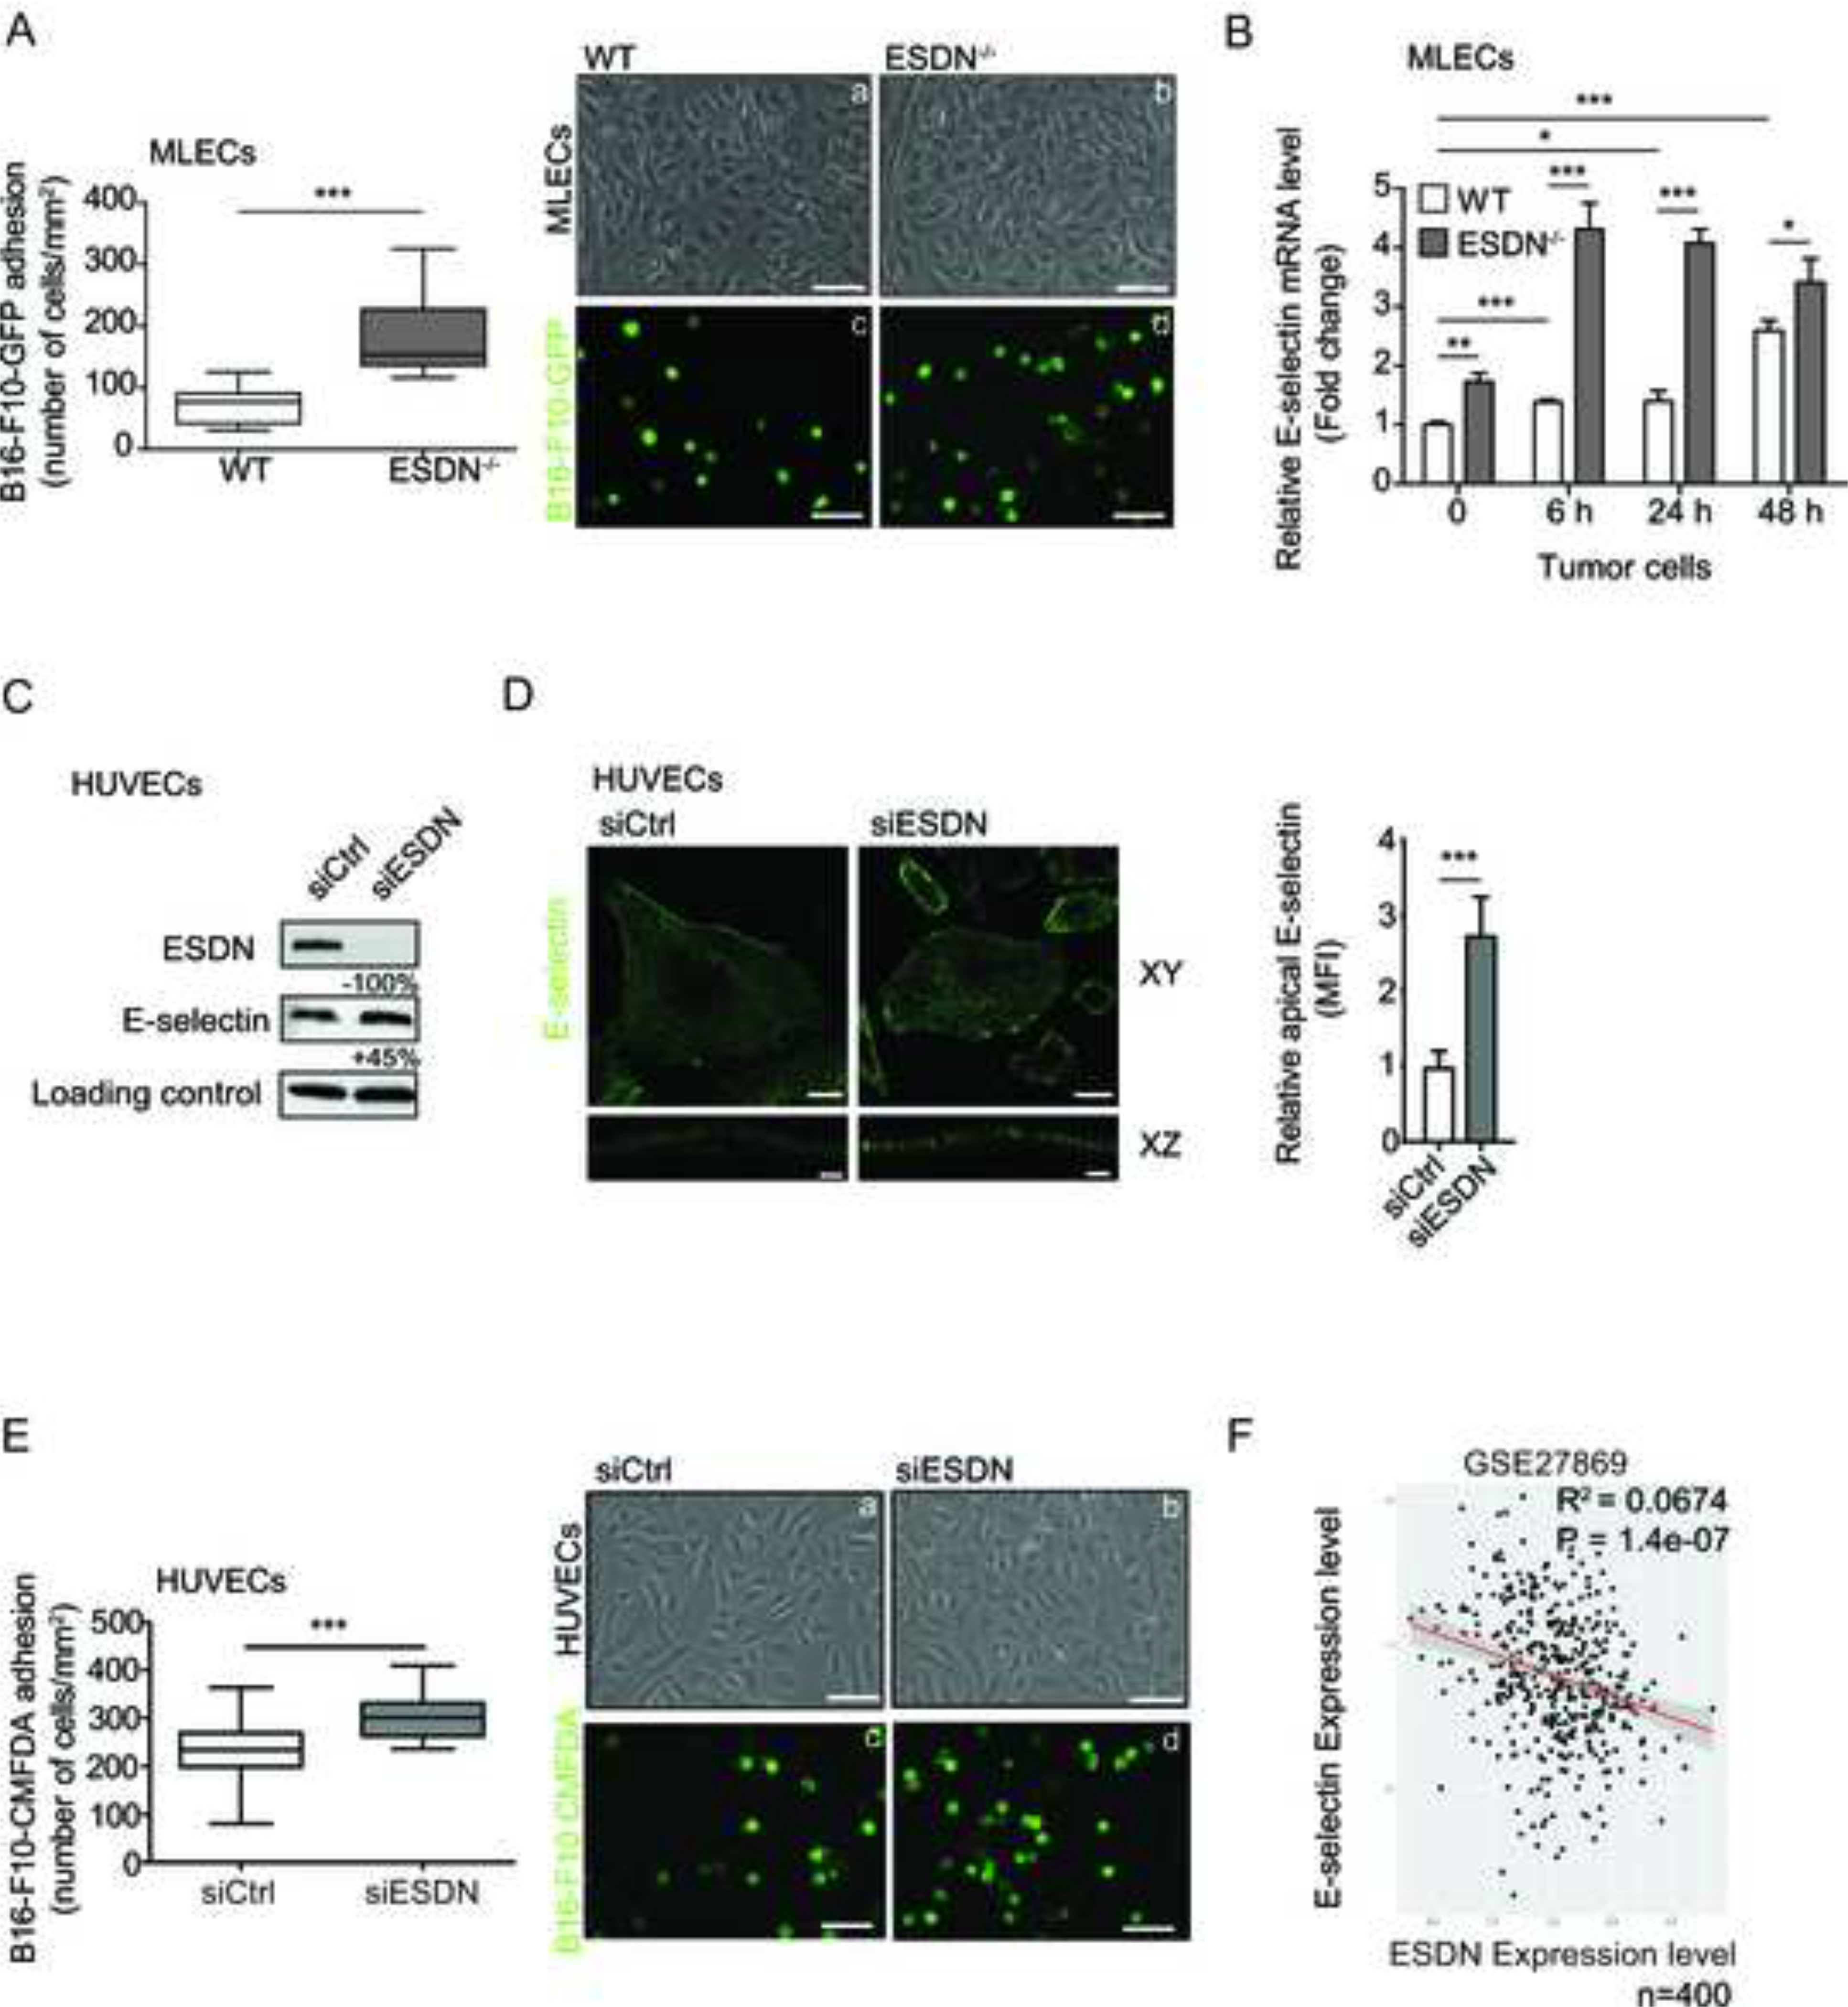
Figure 2 – Depletion of ESDN in endothelial cells favors melanoma cell adhesion and E-selectin expression upregulation.

(A) Evaluation of in vitro adhesion of B16-F10-GFP cells (a–d) on a confluent monolayer of WT (a, c) and ESDN−/− (b, d) MLECs 15 min after seeding. Representative images of confluent WT (a) or ESDN−/− (b) MLECs and adherent B16-F10-GFP (c, d) cells; scale bar = 30 μm. Graph refers to the number (mean ± SEM) of tumor adherent cells per field (mm2). (B) E-selectin mRNA level analysis in MLECs isolated from WT and ESDN−/− mice, noninjected (basal) or 6, 24, and 48 h after tail vein injections of CMRA-labeled B16-F10 cells via qRT-PCR. Results are presented as fold changes (mean ± SEM) relative to WT noninjected samples at time 0, normalized on β-actin mRNA levels. (C) E-selectin and ESDN expression in siCtrl and siESDN HUVECs in basal conditions evaluated by WB analysis. Protein expression has been normalized to GAPDH loading control and modulations of siESDN-transfected cells are expressed as percentages (%) relative to siCtrl samples. (D) Representative images of confocal XY and XZ sectioning of E-selectin (green) cell surface localization in ESDN-silenced (siESDN) or control (siCtrl) HUVECs; scale bar XY = 25 μm; XZ= 3 μm. Graph refers to the normalized mean florescence intensity (MFI) evaluated on 10 cells analyzed in one representative experiment, out of two performed. (E) Evaluation of in vitro adhesion for CMFDA-labeled B16-F10 cells (a–d) on a confluent monolayer of control (siCtrl; a, c) and ESDN-silenced (siESDN; b, d) HUVECs 15 min after seeding. Representative images of siCtrl (a) or siESDN (b) HUVECs and adherent CMFDA-labeled B16-F10 (c, d) cells are depicted; scale bar = 30 μm. Graph refers to the number (mean ± SEM) of tumor adherent cells per field (mm2). (F) Analysis of ESDN and E-selectin mRNA expression in a dataset (GSE27869) of 400 different siRNA-mediated knockdowns on HUVECs. The dot plot superimposing the regression line represents normalized expression and represents an expression anticorrelation. The shaded area represents the 0.95 standard error confidence interval of the regression model predictions. Coefficient of determination R2 and P value are indicated. (A–D) Two independent experiments were performed in triplicate and a representative one is presented. SEM = standard error of the mean; ECs: endothelial cells; GFP = green fluorescent protein; WT = wild type; WB = western blot; n = number of samples; MLECs = mouse lung endothelial cells; HUVECs = human umbelical vein endothelial cells; CMFDA = CellTracker™ Green. * = p < 0.05; ** = p < 0.01; *** = p < 0.001 considered to be statistically significant.
