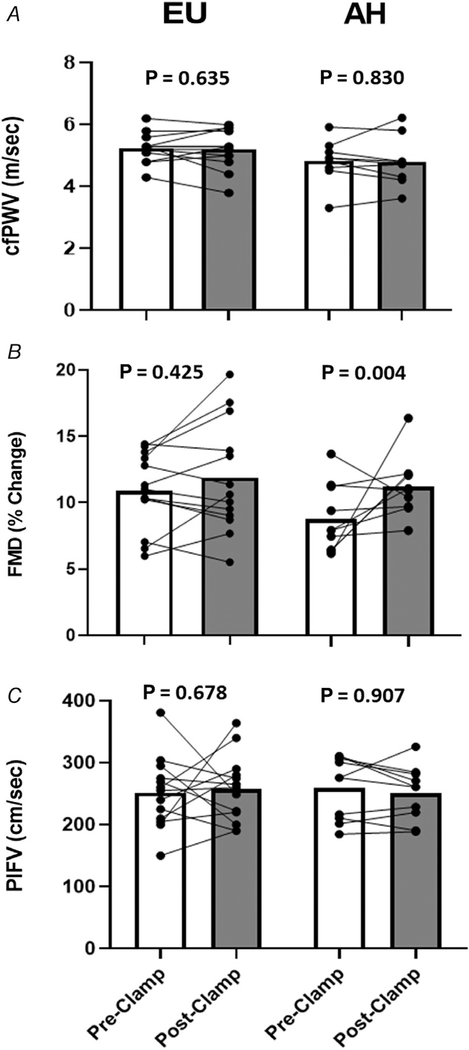
Figure 3. Paired individual trend lines and group mean bar graphs (pre- and post-insulin clamp) detailing cfPWV (A), FMD (B), and PIFV (C) responses to both the EU and AH protocols.
Data are presented as raw (i.e. arithmetic) values. AH, acute hyperglycaemia; cfPWV, carotid-femoral pulse wave velocity; EU, euglylcaemia; FMD, flow-mediated dilatation; PIFV, post-ischaemic flow velocity.

