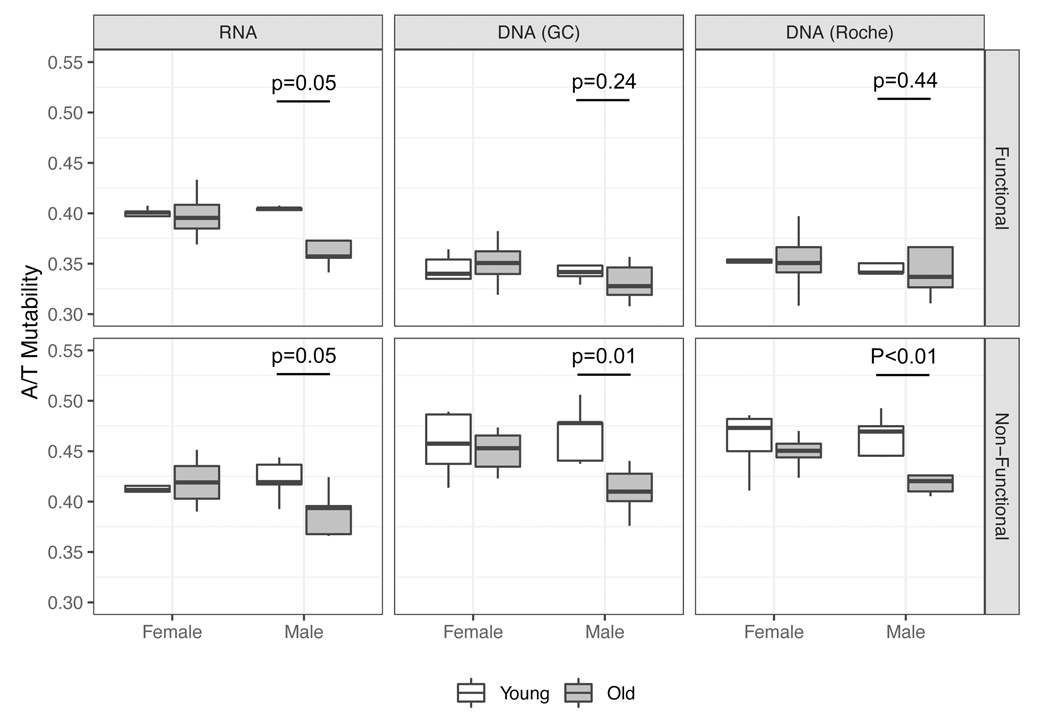
Figure 2: Older males display a lower level of A/T mutability in SHM.
A/T mutability was calculated by normalizing frequency of unselected mutations occurring on A or T nucleotides by frequency of A or T bases in germline immunoglobulin sequences for each individual in the AIRR-seq dataset. Unselected mutations were obtained from silent mutations in functional sequences (Functional) or all mutations in non-functional sequences (Non-functional). Boxes represent the median and interquartile range of A/T mutabilities in each age and sex group. The analysis was performed in all three technical replicates: RNA (left panels), DNA-GC (middle panels), DNA-Roche (right panels). p-values were obtained from Welch’s t-test.

