
Figure 8.
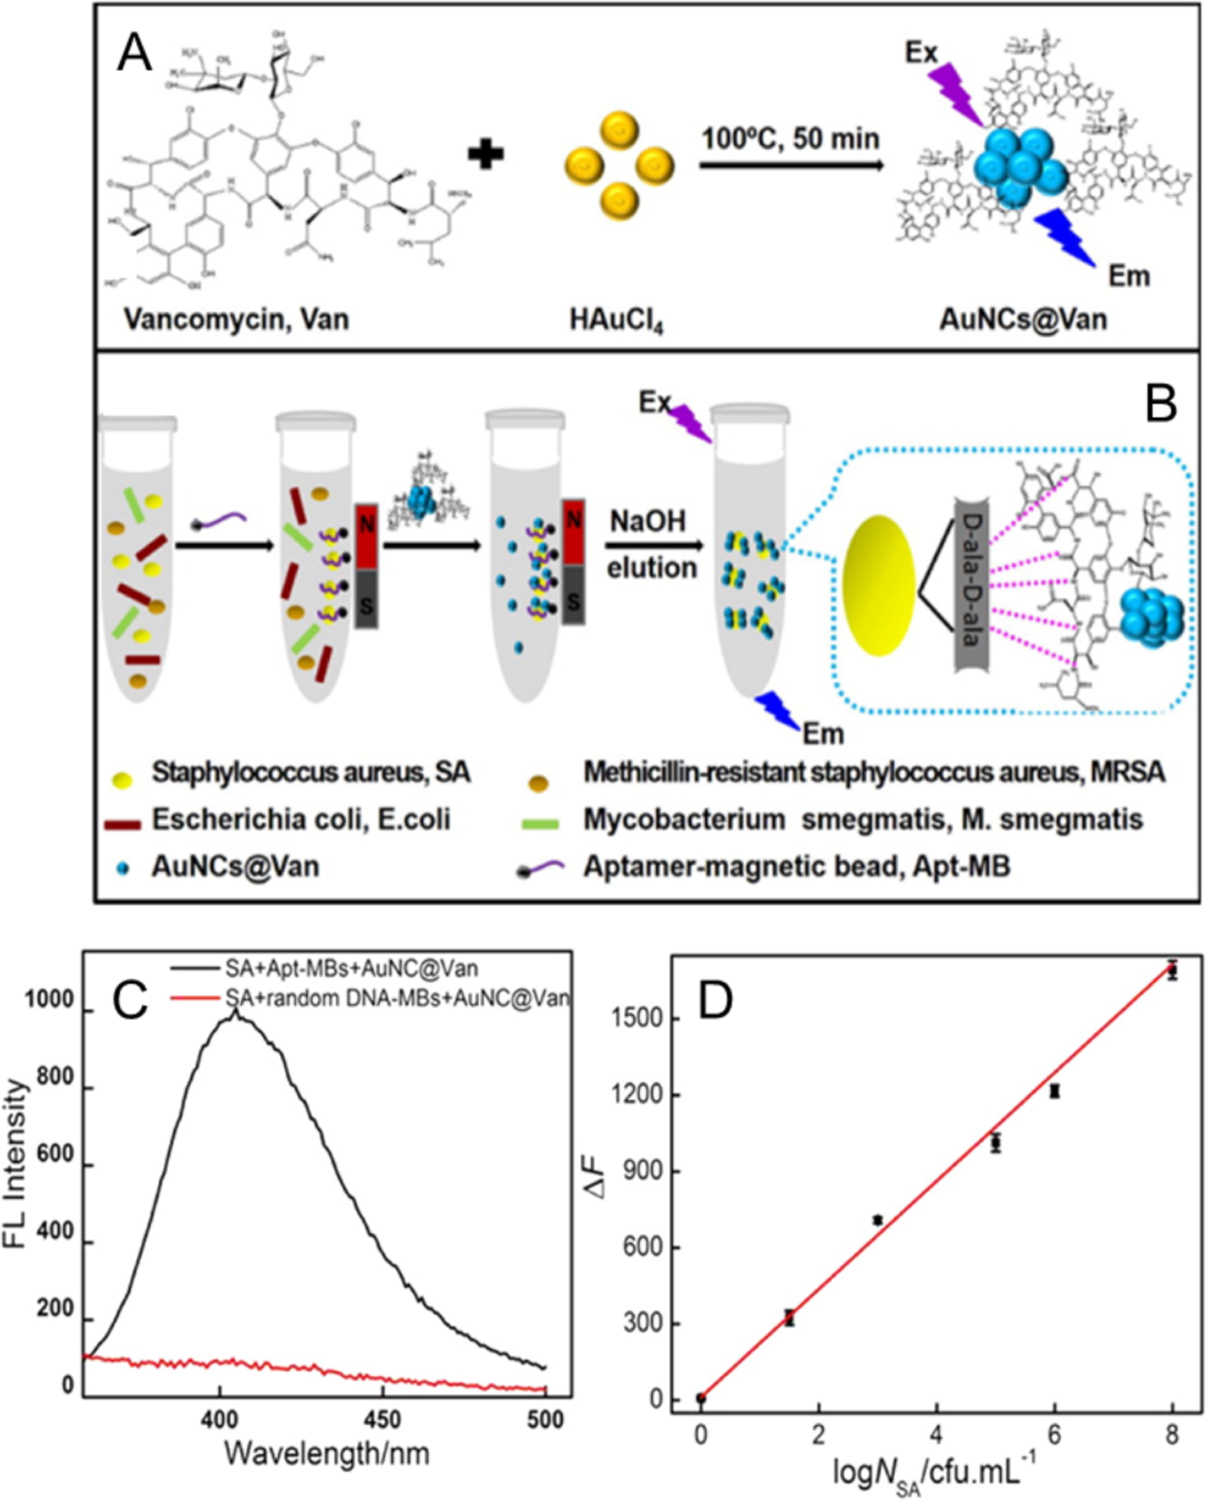
(A) Schematic illustrations of the preparation of AuNCs@Van, (B) and determination of S.aureus in mixtures using the aptamer-MB and AuNCs@Van dual recognition strategy. (C) Fluorescence spectra of detected S. aureus with aptamer-MBs or random DNA-MBs and AuNCs@Van. (D) The linear regression curve of the enhanced fluorescence intensity (ΔF, at 412 nm) vs. the concentration of S. aureus (log NSA/CFU mL−1). Reproduced from Ref.71 Copyright 2016 American Chemical Society.