Fig. 2.
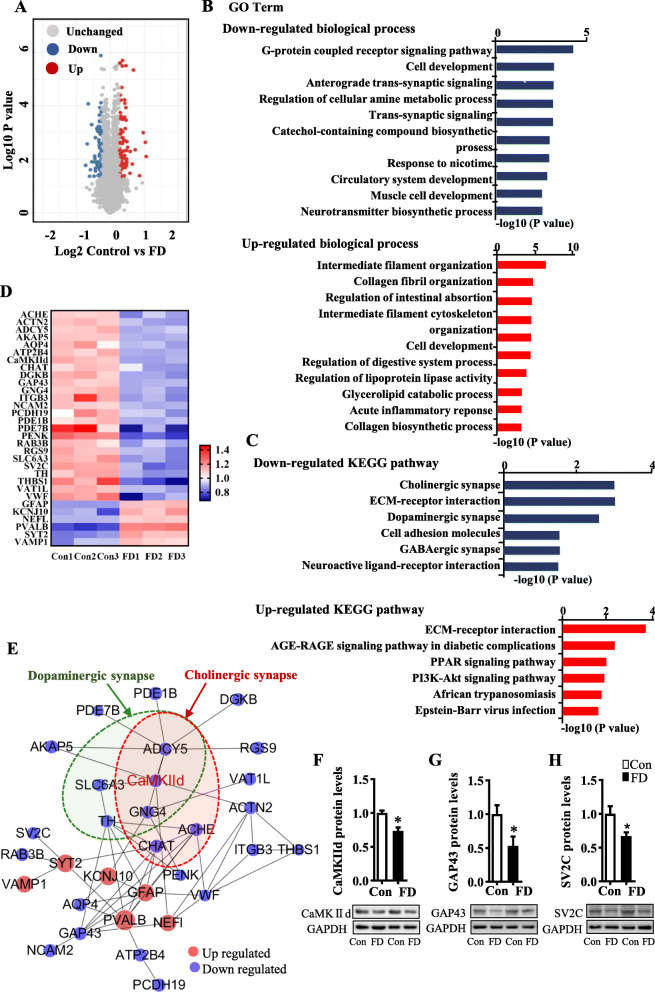
Dietary fiber deficiency for 15 weeks altered synaptic proteome in the hippocampus. A–E The quantitative analysis of the global proteome of the hippocampus (n = 3). A Volcano plot of differentially expressed proteins. B Analysis of GO enrichment of biological process for differentially expressed proteins. C Analysis of KEGG pathway of the differentially expressed synaptic proteins. D The heatmap of the differentially expressed synaptic proteins. E PPI network analysis of distinctly dysregulated proteins based on STRING database and Cytoscape 3.6.0. Black lines denoted the interaction between two proteins. The red node signified up-regulation, blue node signified downregulation. F–H The verification of the quantitative analysis of the global proteome of the hippocampus for downregulated proteins (CaMKIId, GAP43, and SV2C) by western blot (n = 5–6). Values are mean ± SEM. *p < 0.05 fiber deficiency (FD) group vs. control (Con) group

