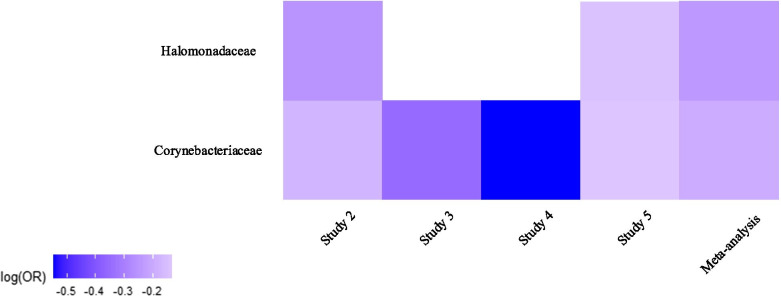
Fig. 3.
Heat map of changes in the relative abundance of Corynebacteriaceae and Halomonadaceae families across all studies. Regression coefficients from GAMLSS-BEZI are log (odds ratio) (log(OR)) of changes in the relative abundance of a specific bacterial taxon between the case and control groups and pooled log (OR) estimate is from a random-effects meta-analysis. The case group is considered as the reference group and shown in the heat map. Log(OR) < 0 indicates a decrease in the relative abundance of Corynebacteriaceae and Halomonadaceae in tumor tissues as compared to tumor-adjacent normal tissues. The white parts in the heat map represent the bacterial taxa that are not available in a particular study

