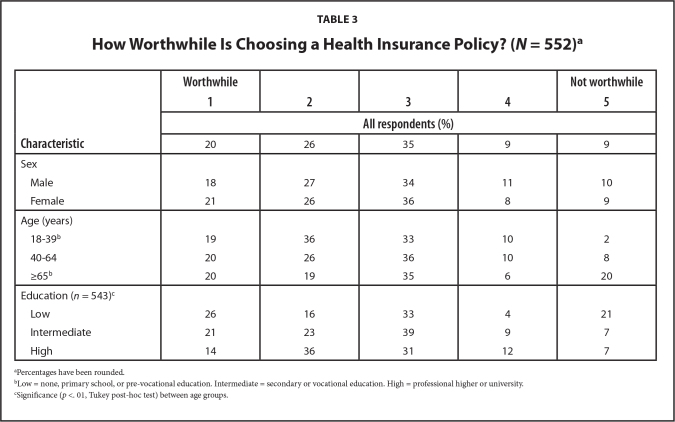
Table 3.
How Worthwhile Is Choosing a Health Insurance Policy? (N = 552)a
| Characteristic | Worthwhile 1 | 2 | 3 | 4 | Not worthwhile 5 |
|---|---|---|---|---|---|
|
| |||||
| All respondents (%) | |||||
|
| |||||
| 20 | 26 | 35 | 9 | 9 | |
|
| |||||
| Sex | |||||
| Male | 18 | 27 | 34 | 11 | 10 |
| Female | 21 | 26 | 36 | 8 | 9 |
|
| |||||
| Age (years) | |||||
| 18–39b | 19 | 36 | 33 | 10 | 2 |
| 40–64 | 20 | 26 | 36 | 10 | 8 |
| ≥65b | 20 | 19 | 35 | 6 | 20 |
|
| |||||
| Education (n = 543)c | |||||
| Low | 26 | 16 | 33 | 4 | 21 |
| Intermediate | 21 | 23 | 39 | 9 | 7 |
| High | 14 | 36 | 31 | 12 | 7 |
Percentages have been rounded.
Low = none, primary school, or pre-vocational education. Intermediate = secondary or vocational education. High = professional higher or university.
Significance (p <. 01, Tukey post-hoc test) between age groups.

