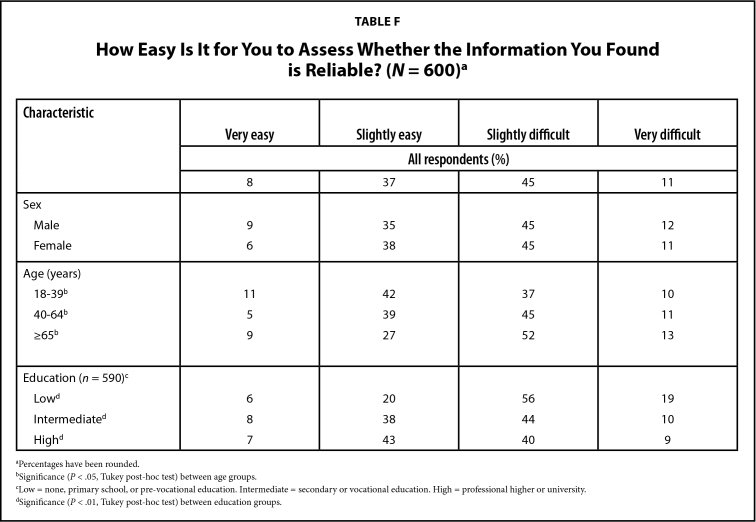
Table F.
How easy Is It for You to Assess Whether the Information You Found is Reliable? (N = 600)a
| Characteristic | Very easy | Slightly easy | Slightly difficult | Very difficult |
|---|---|---|---|---|
|
| ||||
| All respondents (%) | ||||
|
| ||||
| 8 | 37 | 45 | 11 | |
|
| ||||
| Sex | ||||
| Male | 9 | 35 | 45 | 12 |
| Female | 6 | 38 | 45 | 11 |
|
| ||||
| Age (years) | ||||
| 18–39b | 11 | 42 | 37 | 10 |
| 40–64b | 5 | 39 | 45 | 11 |
| ≥65b | 9 | 27 | 52 | 13 |
|
| ||||
| Education (n = 590)c | ||||
| Lowd | 6 | 20 | 56 | 19 |
| Intermediated | 8 | 38 | 44 | 10 |
| Highd | 7 | 43 | 40 | 9 |
Percentages have been rounded.
Significance (P < .05, Tukey post-hoc test) between age groups.
Low = none, primary school, or pre-vocational education. Intermediate = secondary or vocational education. High = professional higher or university.
Significance (P < .01, Tukey post-hoc test) between education groups.

