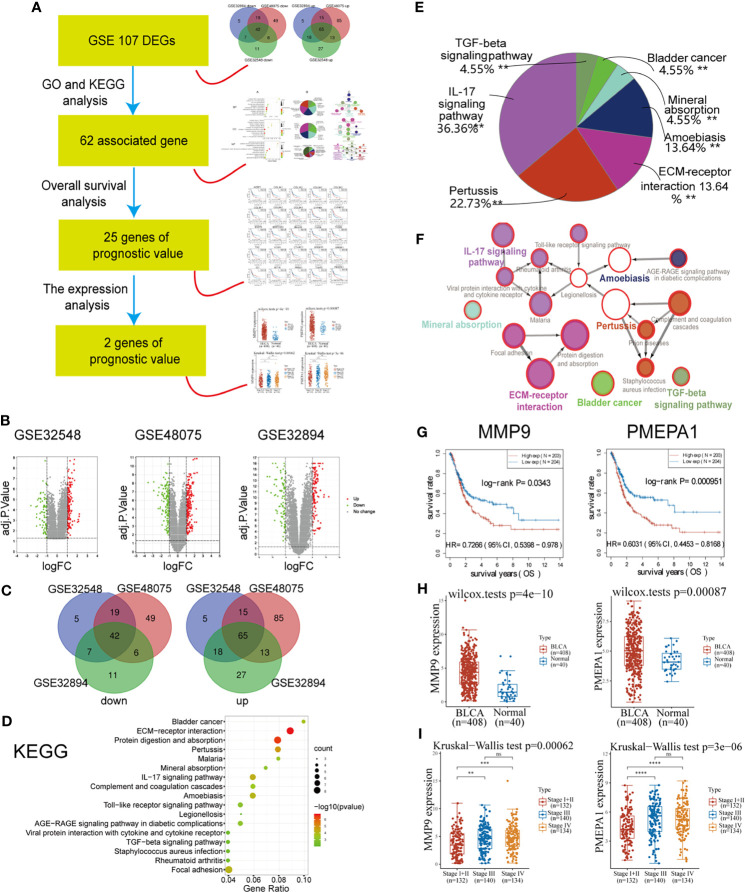
Figure 1.
Identification of PMEPA1 via bioinformatical analysis of the GEO and TCGA databases. (A) The workflow of Figure 1 . (B) Volcano plots were constructed using fold-change values and adjusted P. The red point in the plot indicates the over-expressed mRNAs, and the green point represents the down-expressed mRNAs with statistical significance (p < 0.05). (C) Authentication of 107 common DEGs in the three datasets (GSE32894, GSE48075, and GSE32548) through Venn diagrams software (available online: http://bioinformatics.psb.ugent.be/webtools/Venn/). Different colors indicate different datasets. (D–F) Kyoto Encyclopedia of Genes and Genomes (KEGG) pathway analysis of 107 common DEGs. (D) The bubble chart of the top 17 significant KEGG terms. (E) Pie graph of specific Cluster enriched from KEGG terms. (F) The KEGG regulation network of 107 genes. (D–F) were calculated using Cytoscape 3.6.1 and ClueGO v2.5.7. (G) The survival curve of MMP9 and PMEPA1. Raw counts of RNA-sequencing data (level 3) and corresponding clinical information from BLCA were obtained from the TCGA dataset. For Kaplan–Meier curves, p-values and hazard ratio (HR) with 95% confidence interval (CI) were generated by log-rank tests and univariate Cox proportional hazards regression. (H) The expression distribution of MMP9 and PMEPA1 in BLCA tissues and normal tissues. All data of normal tissue samples were obtained from BLCA in the GTEx V8 release version (https://gtexportal.org/home/datasets). (I) The expression distribution of MMP9 and PMEPA1 among different pTNM stages. All data of BLCA samples were obtained from TCGA dataset.

