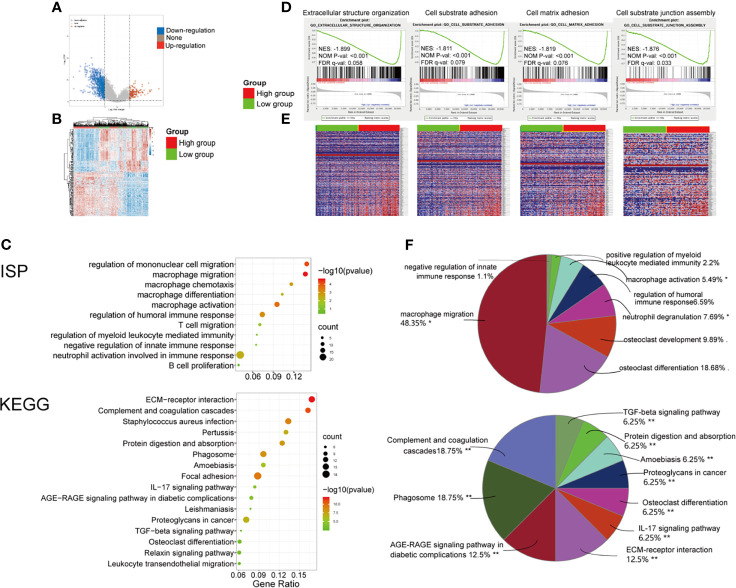
Figure 2.
Significant pathways influenced by PMEPA1 in TCGA and GSE31684. (A, B) Significant pathways influenced by PMEPA1 in TCGA. (A) Volcano plots were constructed using fold-change values and adjusted P. The red point in the plot represents the over-expressed mRNAs, and the blue point indicates the down-expressed mRNAs with statistical significance. (B) Hierarchical clustering analysis of mRNAs, which were differentially expressed between high-PMEPA1 expression tissues and low-PMEPA1 expression tissues. (C, F) GO and KEGG analysis of top 200 up-regulated genes. (C) The top 10 significant GO terms for the immune system process were listed, and the top 16 significant KEGG terms were listed. (F) Pie graph of specific Cluster of GO and KEGG analysis. (D, E) Significant pathways influenced by PMEPA1 in GSE31684 using GSEA analysis. (D) Profile of the running ES score and positions of gene set members on the rank-ordered list. GSEA, gene set enrichment analysis; ES, enrichment score; NES, normalized enrichment score; NOM p-value, normalized p-value; FDR q-value, false discovery rate q-value. (E) Blue-Red O’ Gram in the space of the analyzed genesets, Red color indicated high expression, and blue color indicated low expression. *P < 0.05; **P < 0.01.

