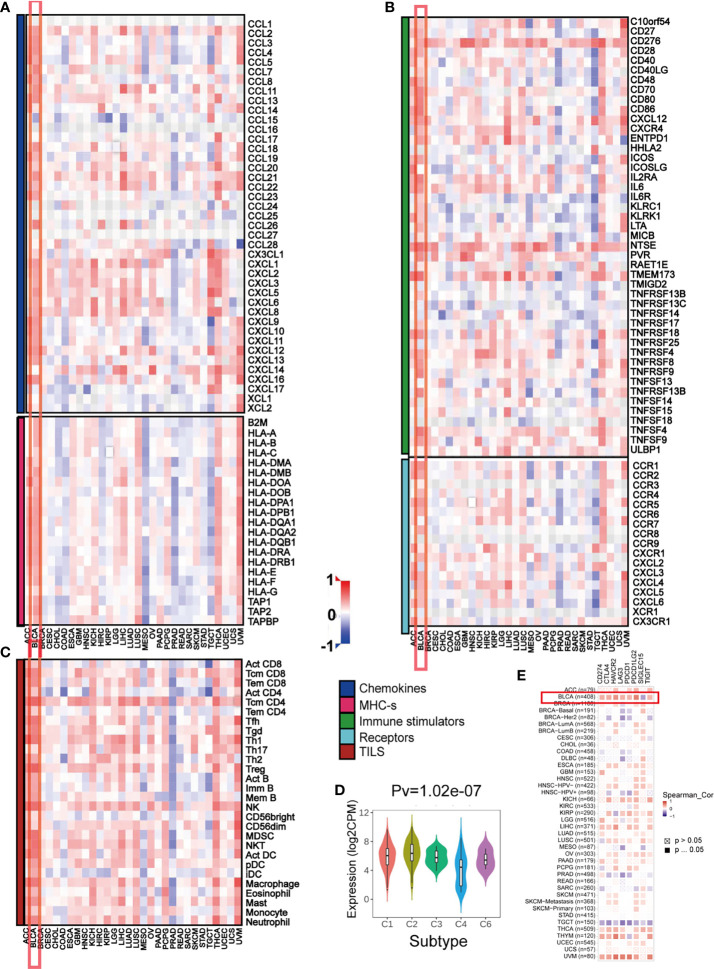
Figure 3.
The effect of PMEPA1 on immunological status in pan-cancers using the TISIDB. (A, B) Correlation between PMEPA1 and 124 immunomodulators (chemokines, MHC-s, immune stimulators and receptors). (C) Correlation between PMEPA1 and 28 tumor-associated immune cells. The color indicates the correlation coefficient. The horizontal axis represents different tumor tissues, and the vertical axis represents the expression of immunomodulators and the infiltration levels of immune cells. (D) PMEPA1 mRNA expression in different immune subtypes in BLCA, C1 (would healing); C2 (IFN-gamma dominant); C3 (inflammatory); C4 (lymphocyte depleted); C5 (immunologically quiet); C6 (TGF-b dominant). (E) Correlation between PMEPA1 and eight immune checkpoints, which were obtained from TIMER database. The horizontal axis represents the expression of immune checkpoint-related genes and the vertical axis represents different tumor tissues. Red color indicates positive correlation, blue color indicates negative correlation, and white color indicates no statistical significance.

