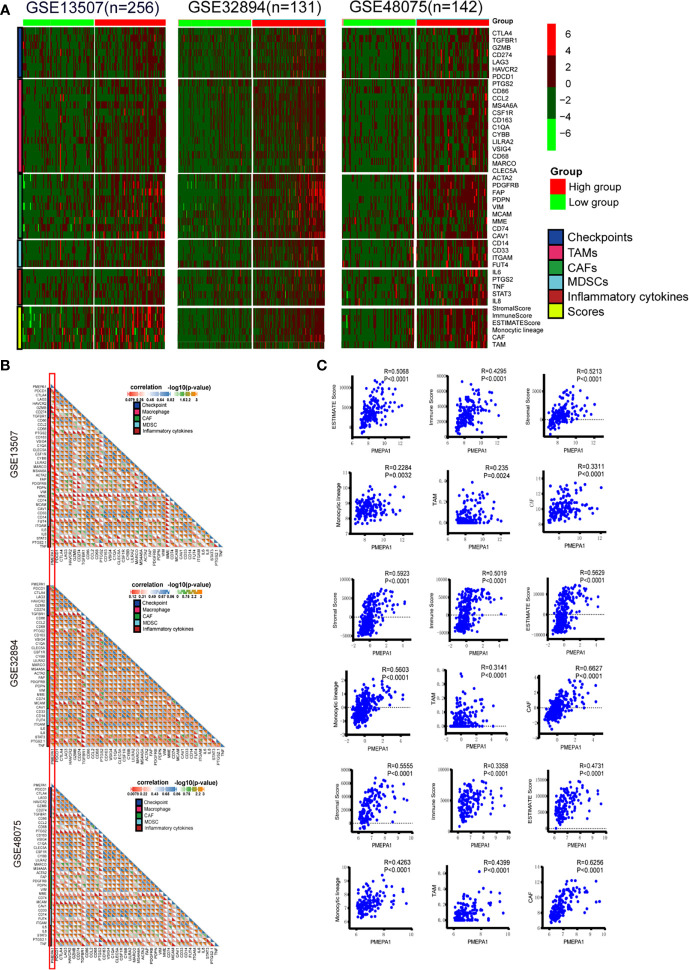
Figure 4.
The effect of PMEPA1 on TME in three datasets [GSE32894(n=131), GSE48075(n=142), GSE13507(n=256)]. (A) Differences in the expression of 38 immune genes (immune checkpoints, marker genes of TAMs, CAFs, MDSCs, and inflammatory cytokines), three immune scores (immune score, stromal score, and ESTIMATE score) of TME and the infiltration levels of three types of TIICs (TAMs, CAFs, and MDSCs) between high- and low-PMEPA1 groups in BLCA. The red color indicates high expression of immune genes, and green color indicates low expression of immune genes. (B) Correlation between PMEPA1 and 38 immune genes (immune checkpoints, marker genes of TAMs, CAFs and MDSCs and inflammatory cytokines). Every little square indicates the correlation between the genes in horizontal axis and vertical axis, the color and the value of the triangle on the lower left indicate the Pearson correlation coefficient, the color and the value of the triangle on the upper right indicate the statistical p-value. (C) The scatterplots display the Pearson’s rho value and p-value of the correlation between PMEPA1 and three TIICs (TAMs, CAFs, and MDSCs) levels and three immune scores of TME.

