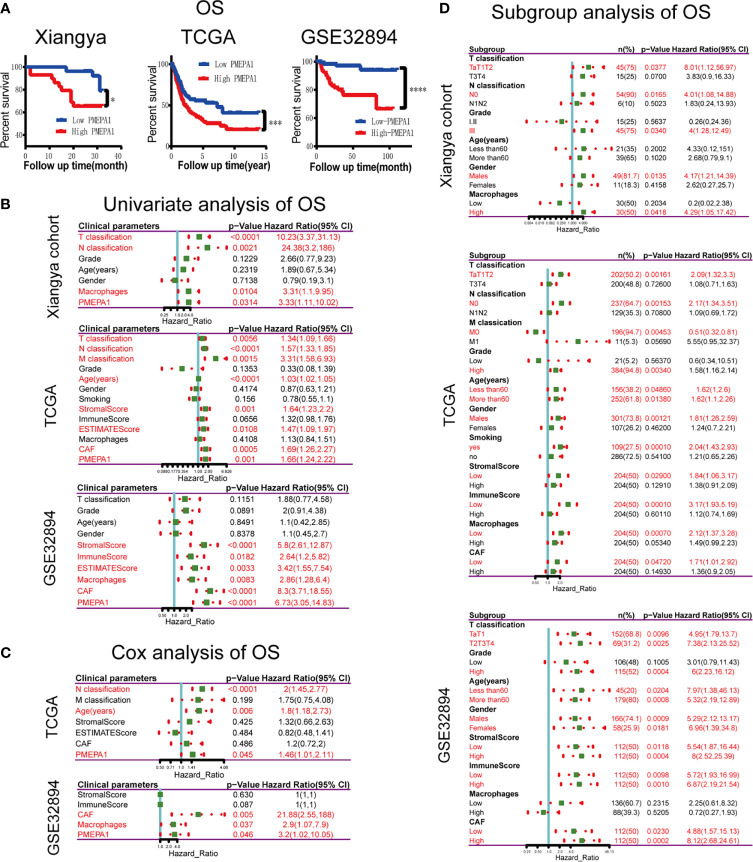
Figure 7.
Survival analysis of clinical parameters and PMEPA1 in three datasets above. (A) Kaplan-Meier survival curve analysis of the low- and high-PMEPA1 group in three datasets [Xiangya cohort (n=60), TCGA (n=408), GSE32894 (n=308)]. (B) Univariate survival analysis of clinical parameters and PMEPA1 expression with OS in three datasets above. (C) Cox survival analysis of clinical parameters and PMEPA1 expression with OS in TCGA and GSE32894. (D) Univariate survival analysis of PMEPA1 expression in subgroups with different clinical parameters. The asterisks indicated a statistically significant p-value (*P < 0.05; ****P < 0.0001). OS, overall survival.

