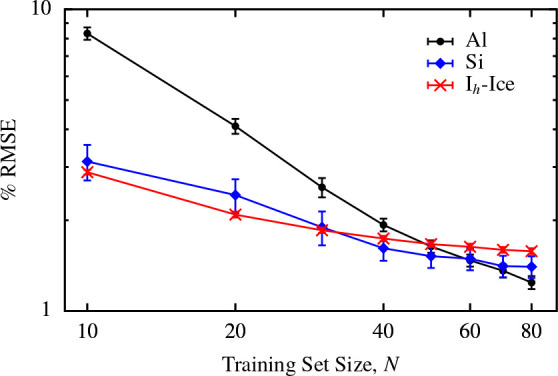
Figure 2.

Learning curves for each of the test data sets. For each point, the percentage root-mean-square error is averaged across 10 randomly selected validation sets, each containing 20 structures; the error bars indicate the standard error in the mean.
