Figure 3.
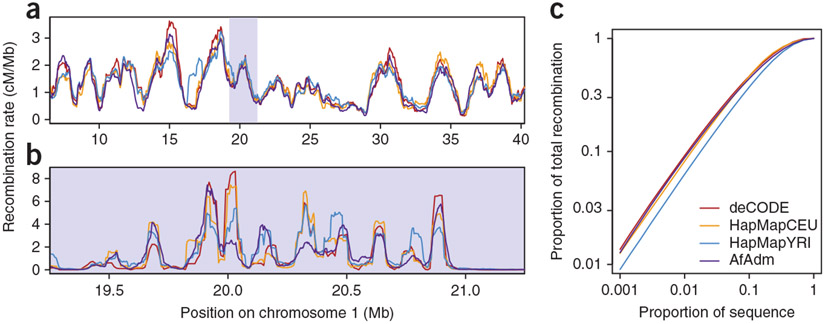
Comparison of the African admixture-based map to existing maps. (a) Example of 1-Mb–scale map from 50 Mb of chromosome 1. (b) Example of 50-kb–scale map from the 2.5-Mb section of chromosome 1 indicated by the gray box in a. (c) Proportion of the total recombination in various proportions of sequence intervals at the 50-kb scale.

